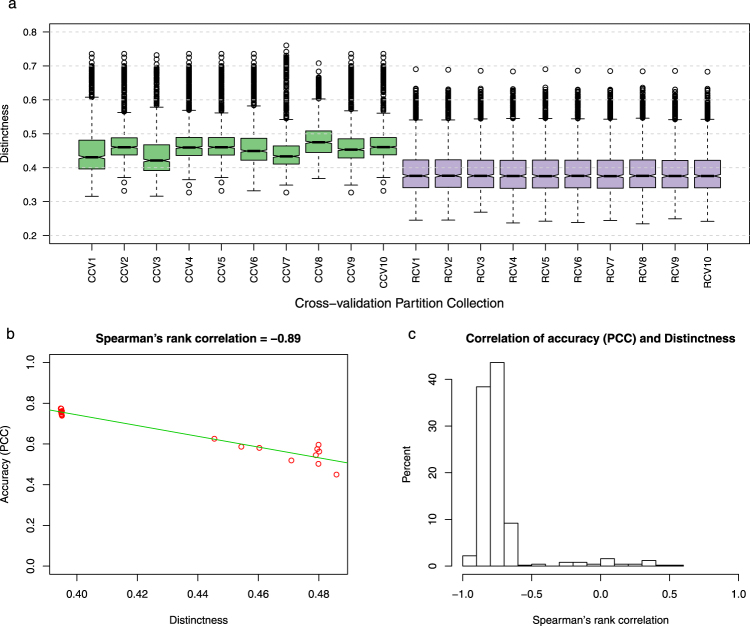
Figure 4.
Distinctness score of test conditions in clustered vs. random cross-validation schemes. (a) The distribution of distinctness score under various cross-validation schemes. Each boxplot represents distinctness scores of 864 conditions corresponding to a CV partition collection. (b) The relationship between distinctness and performance of expression prediction for one gene. The plot shows the PCC values against the values of the distinctness scores for all 20 CV partition collections. The Spearman’s rank correlation between distinctness scores and PCC scores is equal to −0.89 for this gene. (c) Histogram of the Spearman’s rank correlation values between the distinctness and the prediction accuracy for 500 genes. Each correlation value is calculated as shown in Fig. 4b.

