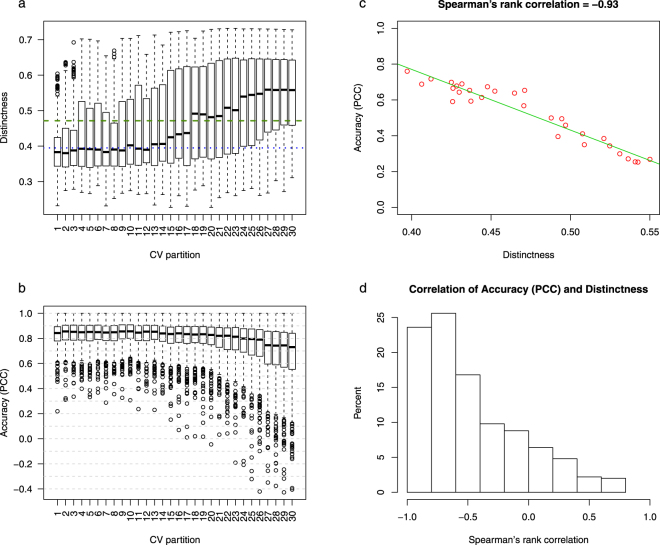
Figure 5.
Systematic generation of cross-validation partitions with gradually increasing distinctness score using simulated annealing. (a) The distribution of distinctness scores of 200 conditions in each CV partition generated using simulated annealing. The dashed and dotted lines show the average distinctness score of the 10 CCV and the 10 RCV partition collections, respectively. (b) The distribution of the test set prediction accuracies for 500 genes. The prediction accuracy is measured using the PCC of model-predicted expression values and real expression values. (c) The accuracy of predicting test set expression of one gene for the 30 CV partitions versus the distinctness score of the CV partitions. (d) The histogram of Spearman’s rank correlation coefficient between the prediction accuracy and average distinctness value, across the 30 CV partitions. The histogram includes one correlation value for each of the 500 genes. Each correlation value is calculated as shown in Fig. 5c.

