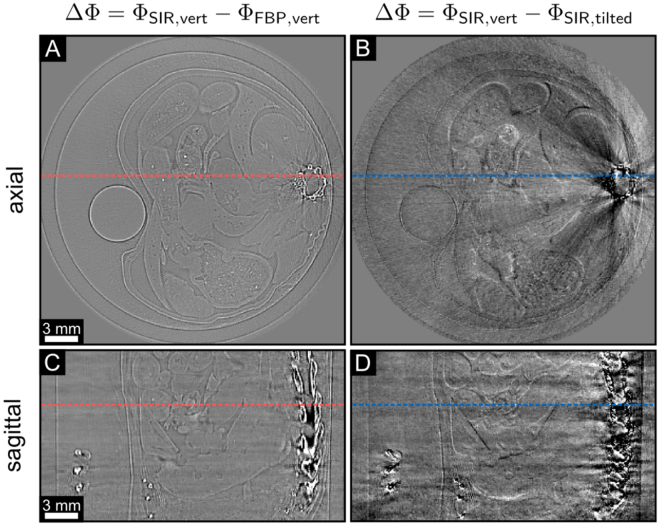
Figure 5.
Difference images between different phase-contrast tomograms. The left column shows the differences between the FBP and the SIR algorithm with vertical gratings in axial (A) and sagittal view (C). The right column shows the differences of the phase-contrast tomograms of the vertical and the tilted grating configuration with SIR, both in axial (B) and sagittal view (D). The slices are the same as depicted in Fig. 4. The arrows with asterisk represent the same area of the slices shown in Fig. 4. The dashed lines indicate the corresponding axial or sagittal slice. All phase-contrast values Φ are ranged in a linear scale of [−0.01, 0.01].

