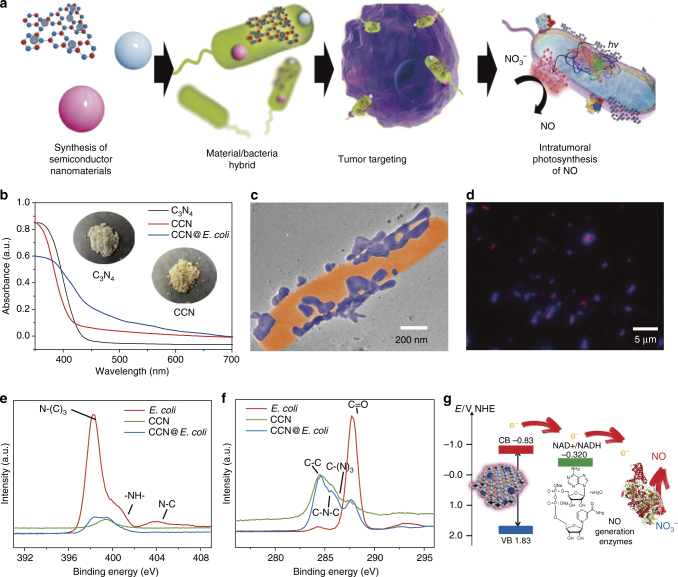
Fig. 1.
Characterization of PMT system. a Schematic diagram of the preparation of PMT system. b UV−Vis absorption spectra of as-prepared CCN. c TEM image of CCN@E. coli. d Spinning disk confocal microscope image of CCN@E. coli (Blue: CCN; Red: E. coli). e XPS de-convoluted spectra for the N1s orbitals of E. coli, CCN, and CCN@E. coli. f XPS de-convoluted spectra for the C1s orbitals of E. coli, CCN and CCN@E. coli. g Schematic illustration for the photoelectron transport among CCN, electron acceptor and NO generation enzymes

