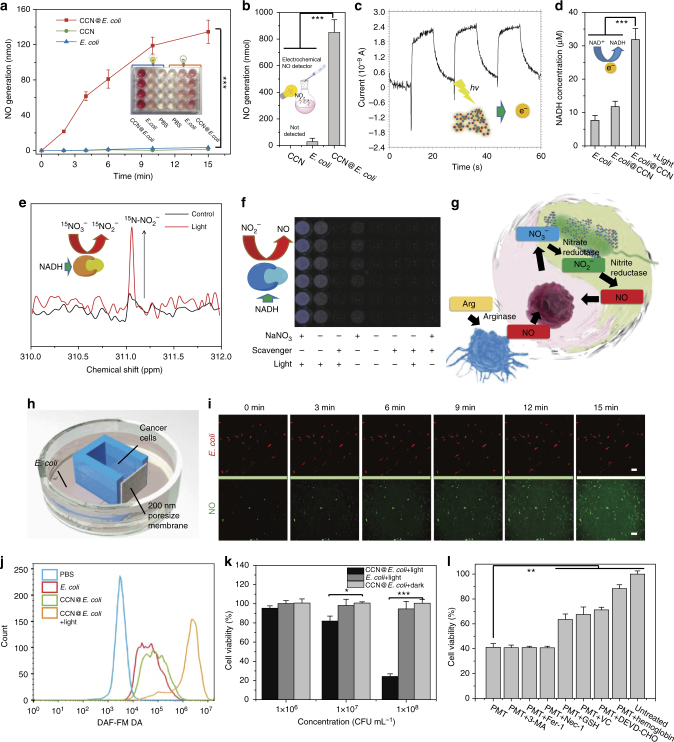
Fig. 2.
In vitro study of PMT system. a Griess method for quantitative determining the NO generation of CCN@E. coli, E. coli (109 CFU, 2 mL), and CCN. b Electrochemical method for monitoring the cumulative NO in the gas phase produced by CCN@E. coli after 15 min of irradiation (1011 CFU, 5 mL). c Transient photocurrent responses of CCN. d Intracellular NADH level of wide-type E. coli, CCN@E. coli with or without light irradiation. e 15N-NMR for monitoring the in situ CCN@E. coli NO3− metabolism with or without light irradiation. The chemical shift of 15N-pyridine in neutral media was defined as 0 ppm. f Luminol chemiluminiscence assay for qualitative determining NO generation of CCN@E. coli, E. coli and CCN. g Schematic illustration for the optically controlled NO metabolism close loop. h Schematic diagram of the 3D-printing co-culture system. i Images from the co-culture system time series sequentially observing CCN@E. coli movement and NO generation (Scale bar: 2 μm for the first row and 100 μm for the second row). j Flow cytometry for measuring the intracellular NO concentration of 4T1 cells after various treatment. k Cell viability of 4T1 cells co-cultured with CCN@E. coli. l Cell viability of 4T1 cells co-cultured with CCN@E. coli after 3-MA (3-Methyladenine, autophagy inhibitor), Fer-1 (ferrostatin-1, ferroptosis inhibitor), Nec-1 (Necrostatin-1, necroptosis inhibitor), Ac-DEVD-CHO (apoptosis inhibitor), hemoglobin treatment (NO scavenger), glutathione (GSH, ROS trapper), sodium ascorbate (VC, ROS trapper). Significance between every two groups was calculated using unpaired two-tailed Student’s t-test unless otherwise indicated. *P < 0.05, **P < 0.01, ***P < 0.001. The mean values and S.D. are presented. Data of panels a, b, d, f, j, k, and l are from >4 biological replicates per sample

