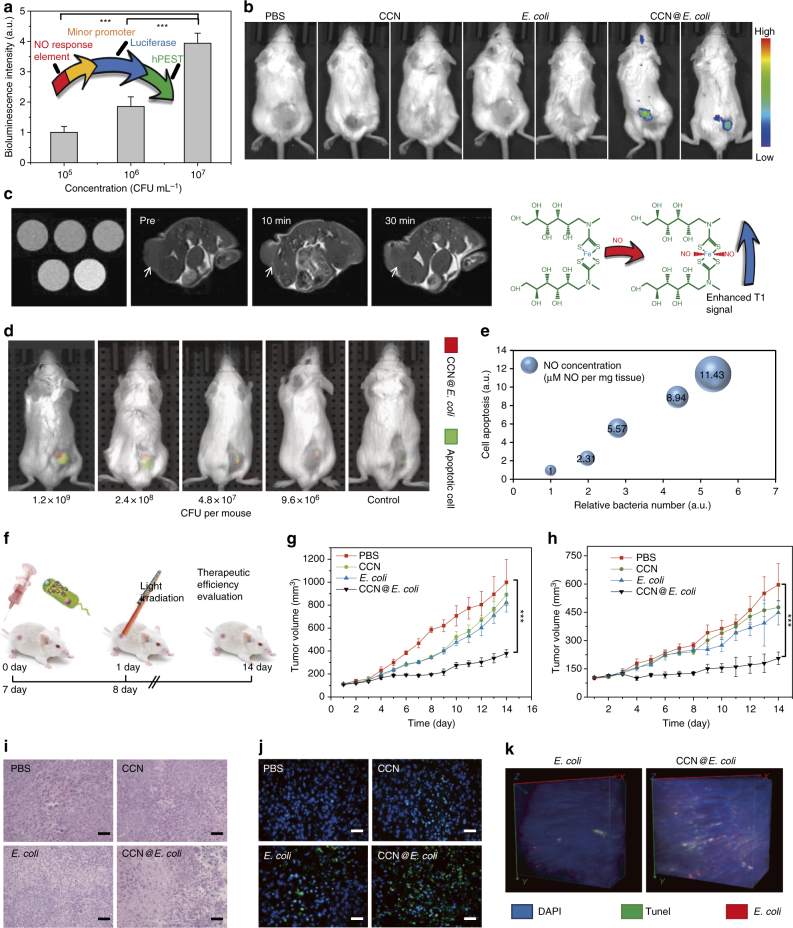
Fig. 4.
In vivo NO generation and anti-cancer effect of PMT system. a Schematic illustration of the NO responsive element contained sensing plasmid and its in vitro NO responsiveness (n = 3). b In vivo NO generation of PMT system in 4T1Nrf2-luc tumor-bearing mice. The imaging was performed 24 h after the i.v. injection of E. coli, CCN@E. coli (108 CFU mL−1 in 200 μL saline), and CCN (5 mg mL−1 in 200 μL saline). c MRI images for detecting both in vitro and in vivo NO generation with the assistance of NO responsive contrast agent Fe-MGD (n = 3). The in vivo imaging was performed 24 h after the i.v. injection of CCN@E. coli (108 CFU mL−1 in 200 μL saline). d Imaging apoptotic response in vivo with annexin V-Cy5.5 (Red: CCN@E. coli, Green: apoptotic cancer cells). The in vivo imaging was performed 48 h after the i.v. injection of CCN@E. coli (108 CFU mL−1 in 200 μL saline). e Semiquantitative analysis of relationship among intratumoral NO concentration (evaluated by the circle area), bacteria count, and signal intensity of apoptotic cells (n = 3). f Schematic diagram of the process of in vivo anti-cancer therapy. Intravenous injection of E. coli, CCN@E. coli (108 CFU mL−1 in 200 μL saline), CCN (5 mg mL−1 in 200 μL saline) and phosphate buffer solution treated group (PBS) were performed on the 1st and 7th days (n = 6). Light irradiation was performed 24 h after the injection ( > 630 nm, 30 mW cm−2, 15 min). g In vivo anti-cancer effect of PMT in 4T1 tumor-bearing mice (n = 6). h In vivo anti-cancer effect of PMT in CT26 tumor-bearing mice (n = 6). i H&E staining of 4T1 tumor after 14 days of PMT (Scale bar: 100 μm). j TUNEL staining of 4T1 tumor after 14 days of PMT (Scale bar: 100 μm). k Three-dimensional fluorescence imaging for visualizing the co-localization of CCN@E. coli and apoptotic region within the tumor. Significance between every two groups was calculated using unpaired two-tailed Student’s t-test. *P < 0.05, **P < 0.01, ***P < 0.001. The mean values and S.D. are presented

