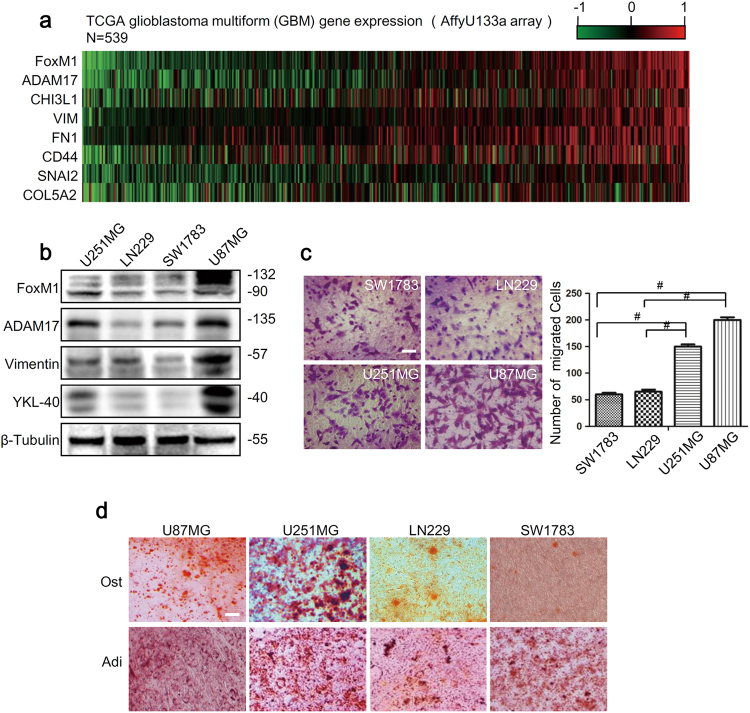
Fig. 1. The expression profiles of FoxM1 and ADAM17 are positively correlated with mesenchymal features in GBM.
a Heatmap of the gene expression profile revealed that FoxM1 and ADAM17 expression profiles were associated with mesenchymal markers expression in glioma specimens from TCGA database. b FoxM1, ADAM17 and mesenchymal markers expression in glioma cells were detected by western blot. β-Tubulin was used as a loading control. c The transwell migration assay was conducted to count the migrated cells of four glioma cell lines. Scale bar = 100 μm. The data are shown as the mean ± s.d. of three independent experiments. Student’s t test was used to determine the significance of the differences between the groups (#P < 0.0001, Student’s t test). d The conditional medium was used to investigate the osteogenesis and adipogenesis potential of four glioma cell lines. Scale bar = 100 μm. Ost osteogenesis, Adi adipogenesis

