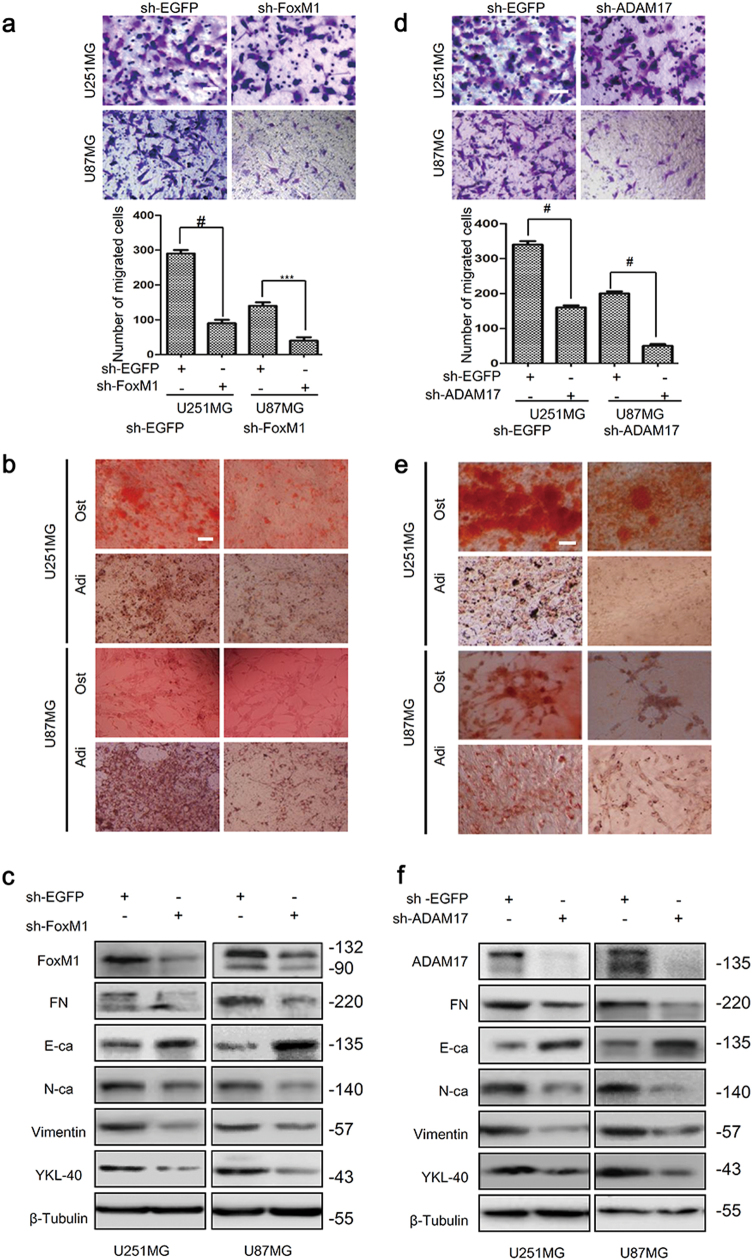
Fig. 2. FoxM1 or ADAM17 knockdown inhibits mesenchymal transition in glioma cells.
a, b FoxM1 knockdown reduced the migration as well as potentialities of adipogenesis and osteogenesis of U251MG and U87MG cells. Scale bar = 100 μm. The data are shown as the mean ± s.d. of three independent experiments. Student’s t test was used to determine the significance of the differences between the groups (***P < 0.001, #P < 0.0001, Student’s t test). c The expression of mesenchymal markers and E-cadherin were detected after knocking down FoxM1 by western blot. d, e ADAM17 knockdown inhibited the migration, adipogenesis and osteogenesis of U251MG and U87MG cells. Scale bar = 100 μm. The data are shown as the mean ± s.d. of three independent experiments. Student’s t test was used to determine the significance of the differences between the groups (#P < 0.0001, Student’s t test). f The expression of mesenchymal markers and E-cadherin were detected after knocking down ADAM17 by western blot. The data are shown as the mean ± s.d. of three independent experiments. Student’s t test was used to determine the significance of the differences between the groups (***P < 0.001, #P < 0.0001, Student’s t test)

