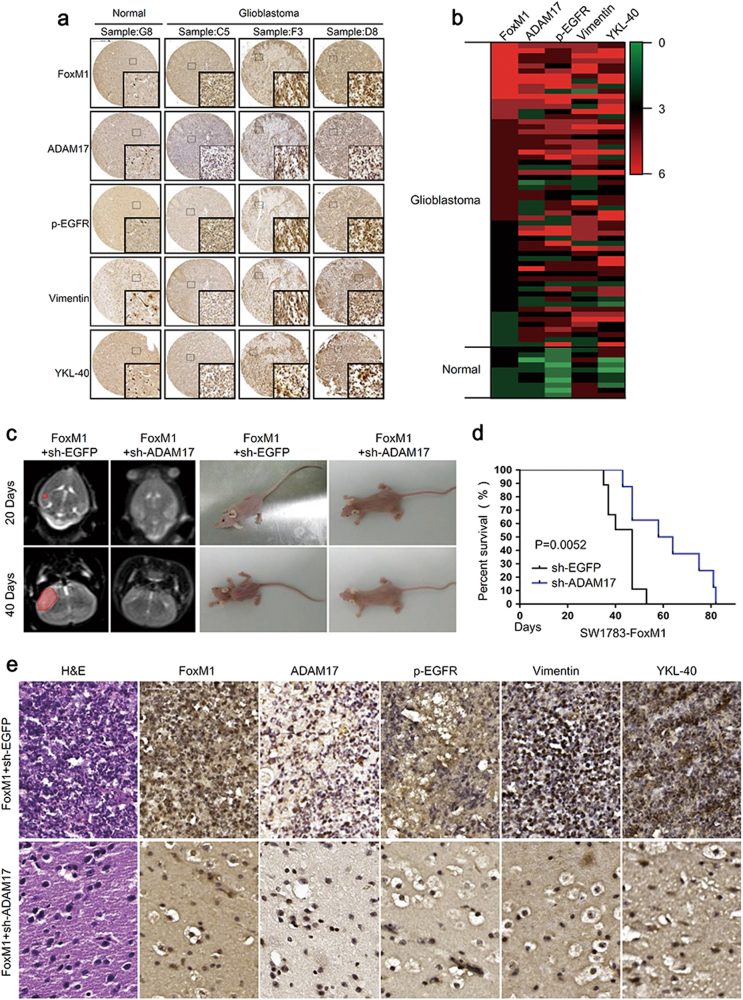
Fig. 6. FoxM1/ADAM17 axis promotes the tumor progression in vivo.
a IHC analyses were used to determine the expression of FoxM1, ADAM17, p-EGFR and mesenchymal markers expression in human glioblastoma samples. Scale bar = 500 μm b The heatmap revealed that ADAM17 expression was highly associated with FoxM1 expression and both of them were correlated with mesenchymal phenotype in GBM. c Twenty and 40 days after tumor implantation, mice were fixed in mice MRI equipment to evaluate the volume of xenograft tumors. d Kaplan–Meier algorithm was performed for evaluating overall survival time of mice between FoxM1-sh-EGFP and FoxM1-sh-ADAM17 groups. *P < 0.05. e HE staining and immunochemistry assays were used to assess the promoting effects of FoxM1/ADAM17 axis on tumor malignancy. Scale bar = 500 μm

