Figure 4.
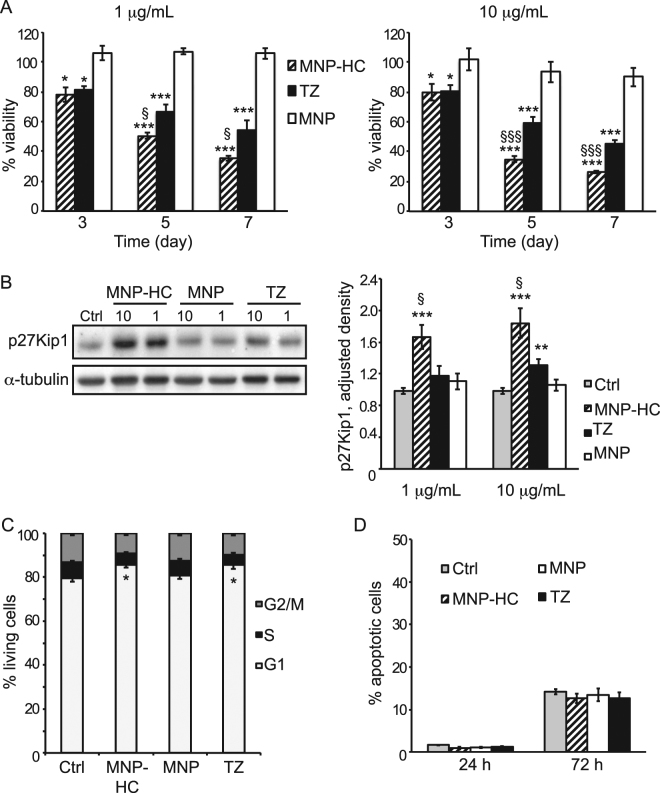
Antitumor activity in HER2+ cells. (A) Viability of SKBR3 treated for 3, 5 or 7 days with 1 (left panel) or 10 (right panel) μg mL–1 of free or nanoformulated TZ, or with equal concentrations of MNP (n = 6). Asterisks indicate significance vs. untreated cultures; § MNP-HC vs. TZ. (B) Western blot analysis of p27Kip1 expression in cells treated with 1 or 10 μg mL–1 of free or nanoformulated TZ, or with equal concentrations of MNP. Densitometric quantification of p27Kip1 was relative to α-tubulin (n = 4). Asterisks indicate significance vs. untreated cells (Ctrl); § MNP-HC vs. TZ. (C) Cell cycle analysis of SKBR3 treated with MNP-HC, MNP or TZ for 72 h. Results are mean percentage of cells in G1, S or G2/M phase (n = 7). Asterisks indicate significance vs. untreated cells (Ctrl). (D) The percentage of apoptotic cells was determined upon 24 or 72 h of treatment with MNP-HC, MNP or TZ (15 μg mL−1), and compared to untreated cells (Ctrl, n = 6).

