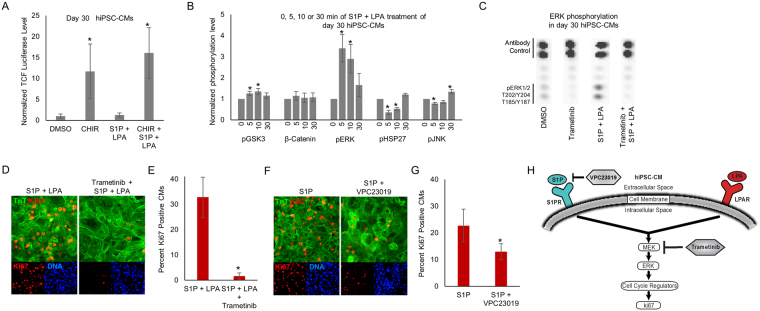
Figure 5.
Reactivation of cell cycle in hiPSC-CMs with S1P and LPA is dependent on ERK signaling. (A) Luciferase luminescence intensity after transfection of day 30 hiPSC-CMs with TOPFlash Wnt signaling pathway activity reporter and 2-hour treatment with CHIR, S1P/LPA or both. The data shown represents fold increase over DMSO control. (B) Quantification of kinase assays illustrating alterations in hiPSC-CM kinome phosphorylation in response to 0, 5, 10, and 30-minute S1P/LPA treatment. Data expressed as means ± SEM. *indicates P < 0.05. (C) Representative kinase assay conducted in day 30 hiPSC-CMs treated with and without small molecule MEK inhibitor trametinib, with and without S1P/LPA (10 μM each). Spots corresponding to ERK phosphorylation and antibody control are labeled. (D) Immunofluorescence for cardiac troponin T (TnT) (green), ki67 (red) and nuclear DNA (blue) in day 30 hiPSC-CMs treated with S1P and LPA in the presence or absence of MEK inhibitor trametinib. (E) Quantification of the percentages of ki67 positive cardiomyocytes (CMs) in (D). *indicates P < 0.001. (F) Immunofluorescence for cardiac troponin T (TnT) (green), ki67 (red) and nuclear DNA (blue) in day 30 hiPSC-CMs treated with bioactive lipid S1P in the presence or absence of 5 μM S1P receptor antagonist VPC23019. (G) Quantification of the percentages of ki67 positive CMs after S1P treatments with or without 5 μM VPC23019. (H) Model illustrating the link between bioactive lipids and the canonical MAPK/MEK/ERK signaling pathway in differentiated hiPSC-CMs. N=4.

