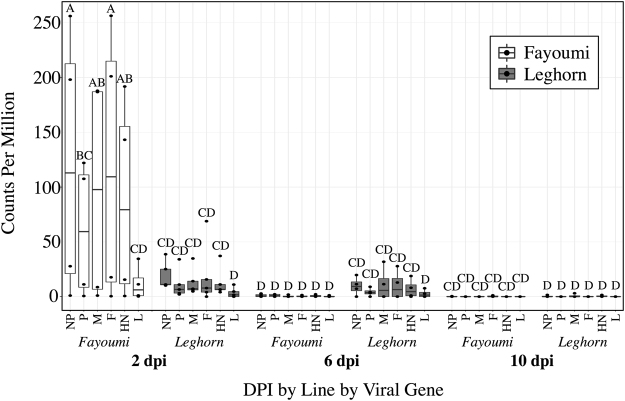
Figure 1.
Viral transcripts detected in the unmapped reads of the challenged Fayoumis and Leghorns at 2, 6, and 10 days post infection. Points within each box plot represent the counts per million (cpm) (y-axis) of each viral gene from 3′ to 5′: Nucleoprotein (NP), Phosphoprotein (P), Matrix protein (M), Fusion protein (F), Hemagglutinin-neuraminidase (HN), or Polymerase (L), in the challenged Fayoumi (white) or Leghorn (grey), at 2, 6, or 10 dpi (x-axis). A Student’s t-test connecting letters report was generated. Box plots that do not share letters are significantly different from each other. For each group n = 4, except the Leghorns at 2 dpi (n = 5) and the Fayoumis at 10 dpi (n = 3).

