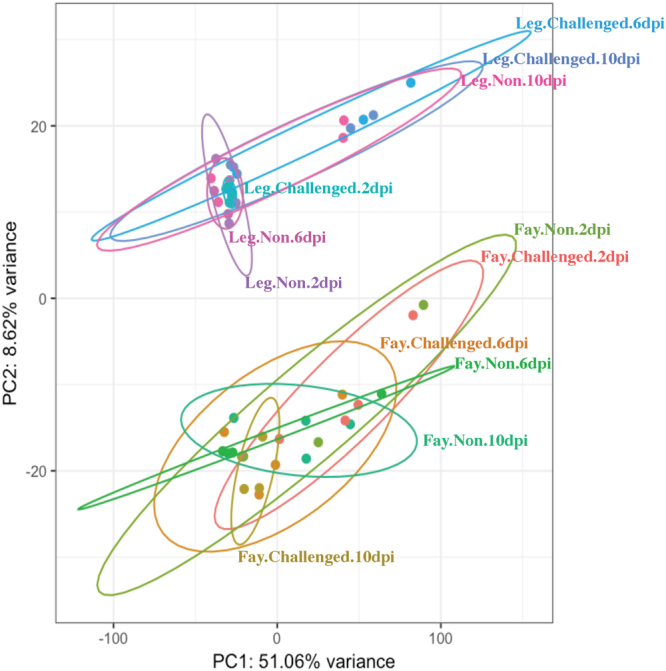
Figure 2.

Principal component analysis plot generated by pcaExplorer. Each dot represents a sample colored to separate by line (Fayoumi: Fay; Leghorn: Leg), challenge status (Challenged; Nonchallenged: NON), and time (2, 6, and 10 dpi). Ellipses were drawn around each treatment group with 95% confidence. The top 5000 genes were used to calculate the principal components. Principal component 1 (PC1) accounts for 51.06% of the variance in the Harderian gland transcriptome. PC2 accounts for 8.62% of the variance and clusters clearly separate by line.
