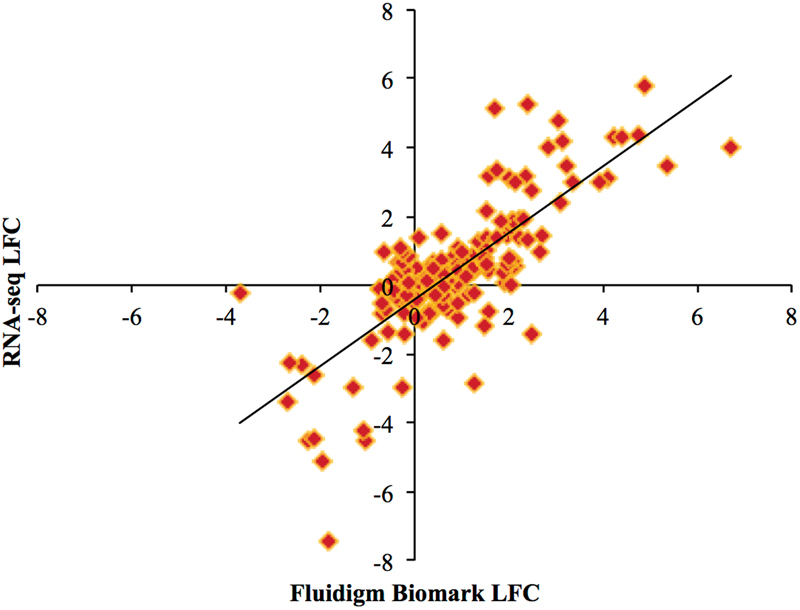
Figure 5.

Scatterplot correlation between LFC estimated by RNA-seq and Fluidigm Biomark. Each point represents a gene’s log fold change (LFC) as measured by RNA-seq (y-axis) and Fluidigm Biomark (x-axis). Contrasts between challenged and nonchallenged birds within each line and within each time were used to generate this plot. A total of 32 genes were analyzed across these six different contrasts resulting in 192 data points. The correlation between the two technologies was r = 0.77.
