Fig. 3.

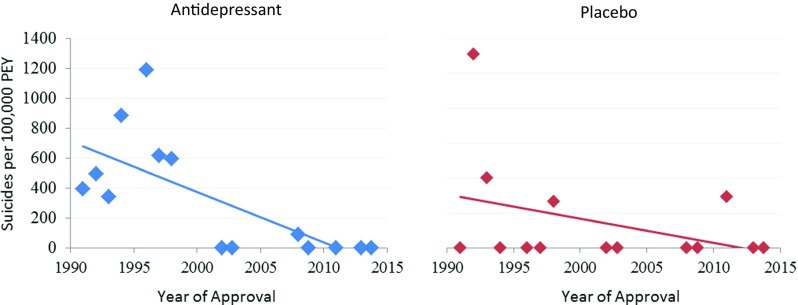
Rates of suicide per 100,000 patient exposure years plotted with year of approval. Rates from antidepressant (blue) and placebo (red) are plotted separately

Rates of suicide per 100,000 patient exposure years plotted with year of approval. Rates from antidepressant (blue) and placebo (red) are plotted separately