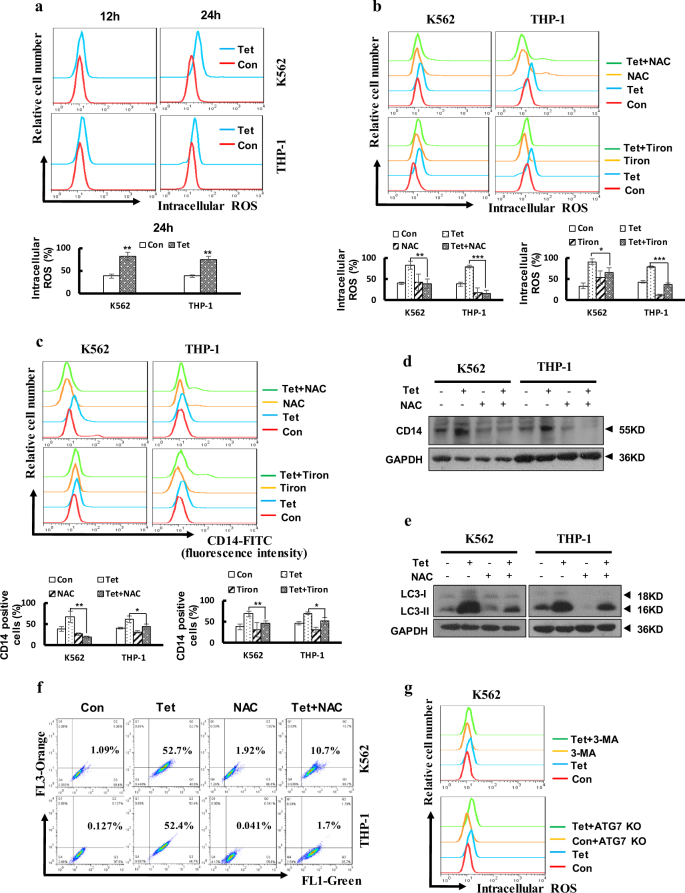
Fig. 4. Tetrandrine induced accumulation of intracellular ROS, leading to cell autophagy and differentiation.
The bars indicate the S.D. *p < 0.05, **p < 0.01, ***p < 0.001. (a) Intracellular ROS levels were assessed by flow cytometry after treatment with DMSO or 2 μM tetrandrine for 12 h or 24 h. (b) The cells were pretreated with NAC (K562 with 15 mM and THP-1 with 10 mM) and Tiron (K562 with 0.5 mM and THP-1 with 0.2 mM) for 1 h, and then treated with DMSO or 2 μM tetrandrine for 24 h. The intracellular ROS levels were measured by flow cytometry (c) or CD14 expression was measured by flow cytometry after 4 days of treatment. (d) CD14 and GAPDH levels were analysis by western blot after the indicated treatments for 4 days. (e) After 24 h of treatment, the LC3 and GAPDH levels were measured by western blots and (f) cells were stained with acridine orange and then analyzed by flow cytometry. (g) After 24 h of DMSO or 2 μM tetrandrine treatment, flow cytometry was used to detect the generation of ROS in K562 ATG7 KO cells and K562 cells pretreated with 1.5 mM 3-MA

