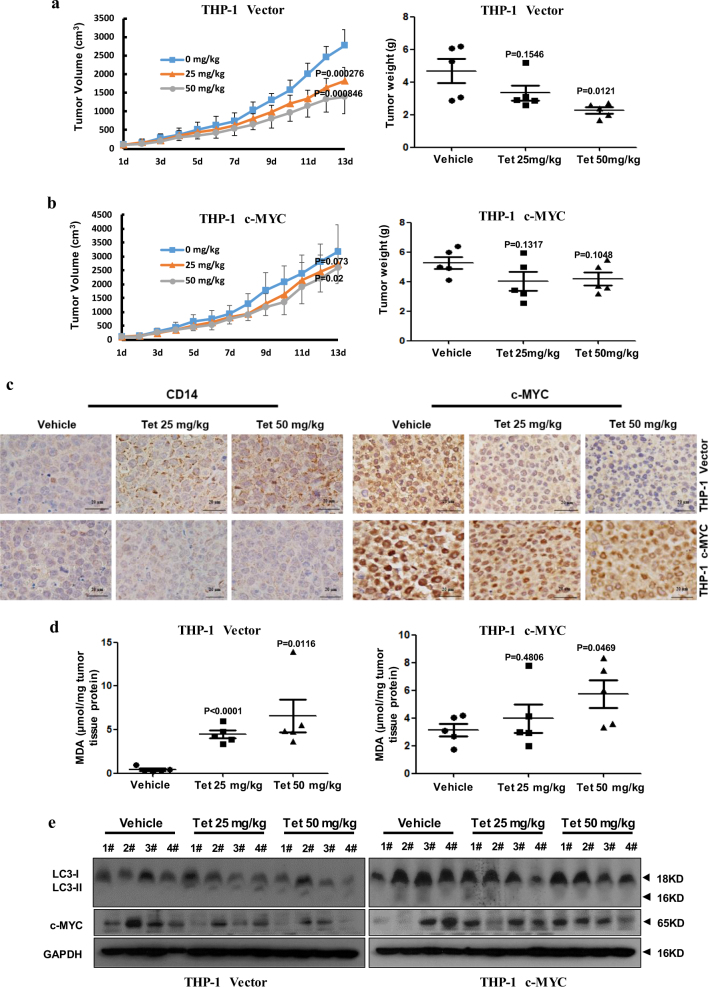
Fig. 6. Tetrandrine induced differentiation in an in vivo xenograft model.
The bars represent the mean ± S.D. (a), (b) Tumor volume was measured daily. The tumors were removed by dissection and weighed after 13 days of treatment. (c) CD14 and c-MYC expression were evaluated by immunohistochemistry analysis in tumor tissues. Magnification: ×400. (d) Tumor tissue proteins were extracted from the THP-1 vector and c-MYC xenografts and were subjected to MDA assay to analyze tissue ROS levels. (e) Western blot analysis of c-MYC, LC3 and GAPDH levels in tumor tissues

