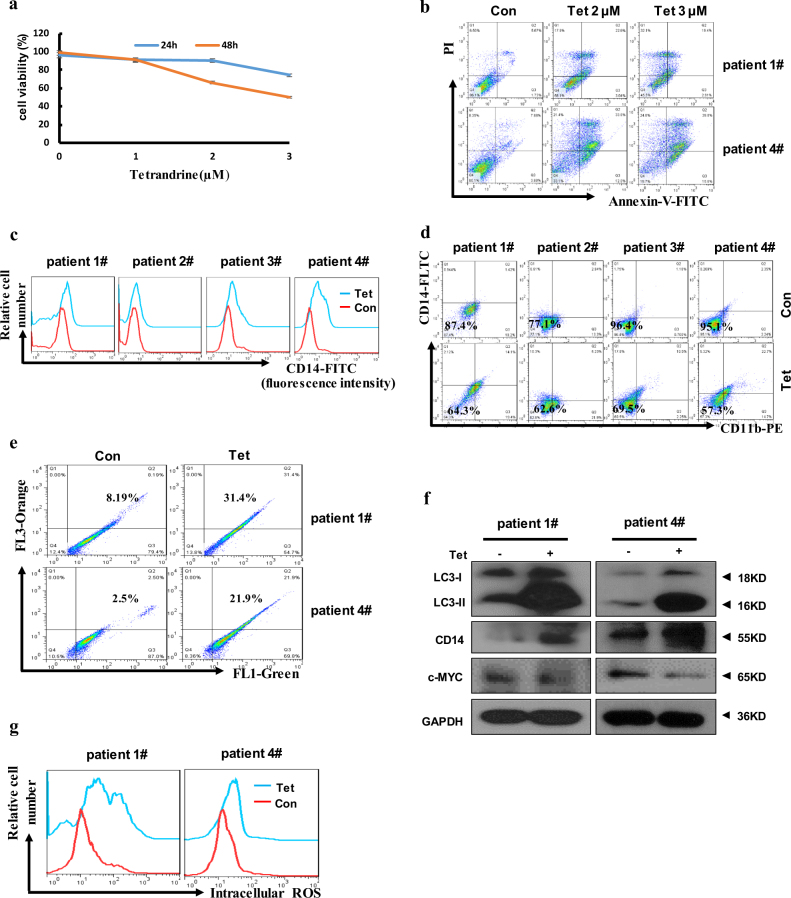
Fig. 7. Tetrandrine induced differentiation and autophagy in AML patient cells.
(a) Cell viability was analyzed by trypan blue dye-exclusion assays. The bars indicate the S.D. n = 3. (b) Patient #1 and #4 apoptotic cells were analyzed by flow cytometry after treatment with tetrandrine at the indicated concentrations. (c) Analysis of CD14 or (d) CD14 and CD11b expression by flow cytometry after DMSO or 2 μM tetrandrine treatment in all patient cells for 3 days. (e) The patient #1 and #4 cells were treated with DMSO or 2 μM tetrandrine for 24 h, stained with acridine orange, and then analyzed by flow cytometry. (f) Western blot analysis of LC3, CD14, c-MYC and GAPDH in tetrandrine-treated #1 and #4 patient cells. (g) After 24 h treatment, the intracellular ROS levels were assessed via flow cytometry analysis in #1 and #4 patient cells

