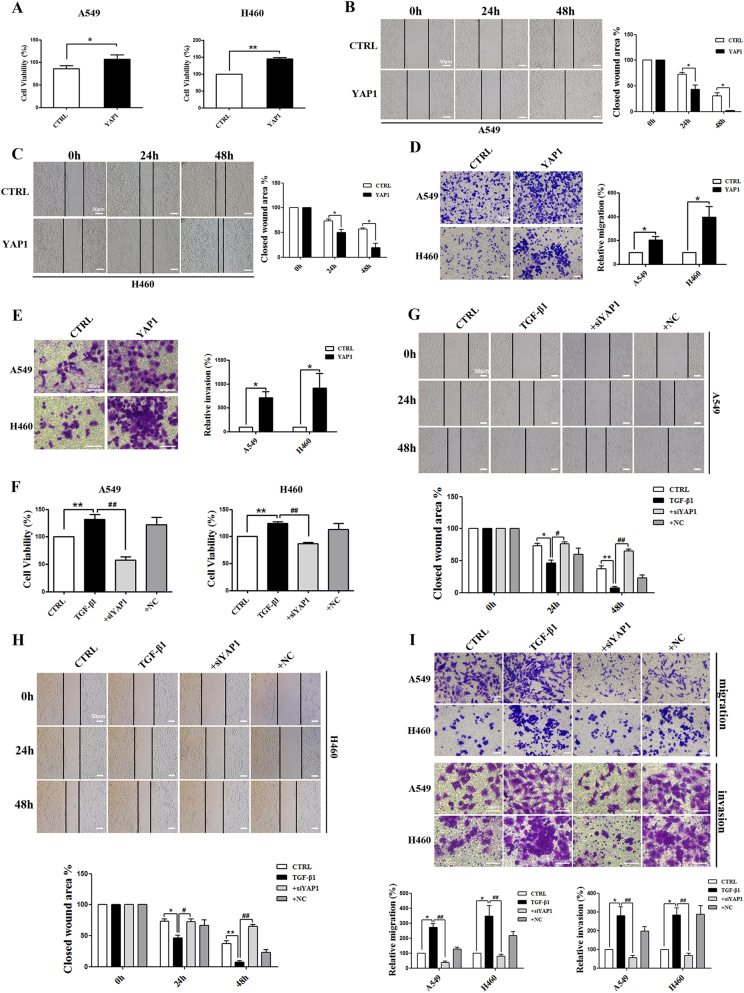
Fig. 2. Effects of YAP1 on cell proliferation, migration, and invasion in vitro.
a MTT analysis of cell viability in A549 and H460 cells overexpressing YAP1. Representative images from wound-healing assays using A549 cells (b) and H460 cells (c) overexpressing YAP1 at 0, 24, and 48 h after scratching (left panels). The wound-healing assay results are quantified in the histogram (right panel). Representative images of the migration (d) and invasion (e) of A549 and H460 cells overexpressing YAP1 from transwell assays (left panel). Cell counts are for the corresponding assays of at least four random microscope fields (migration: ×100 magnification; invasion: ×200 magnification). Cell migration and invasion are expressed as a percentage of the control (right panel). f MTT analysis of cell viability in A549 and H460 cells with YAP1 silencing. g–h Representative images from wound-healing assays using A549 and H460 cells with YAP1 silencing at 0, 24, and 48 h after scratching. The wound-healing assay results for A549 and H460 cells with YAP1 silencing are quantified in the histogram. i Representative images of the migration (top panel) and invasion (medium panel) of A549 and H460 cells with YAP1 silencing from transwell assays. Cell counts are for the corresponding assays of at least four random microscope fields (migration: ×100 magnification; invasion: ×200 magnification). Cell migration and invasion are expressed as a percentage of the control (bottom panel). The scale bars indicate 50 µm. The experiments were performed at least three times, and the data are presented as the mean ± SEM. n = 4–8; *P < 0.05, **P < 0.01 vs. CTRL; #P < 0.05, ##P < 0.01 vs. TGF-β1

