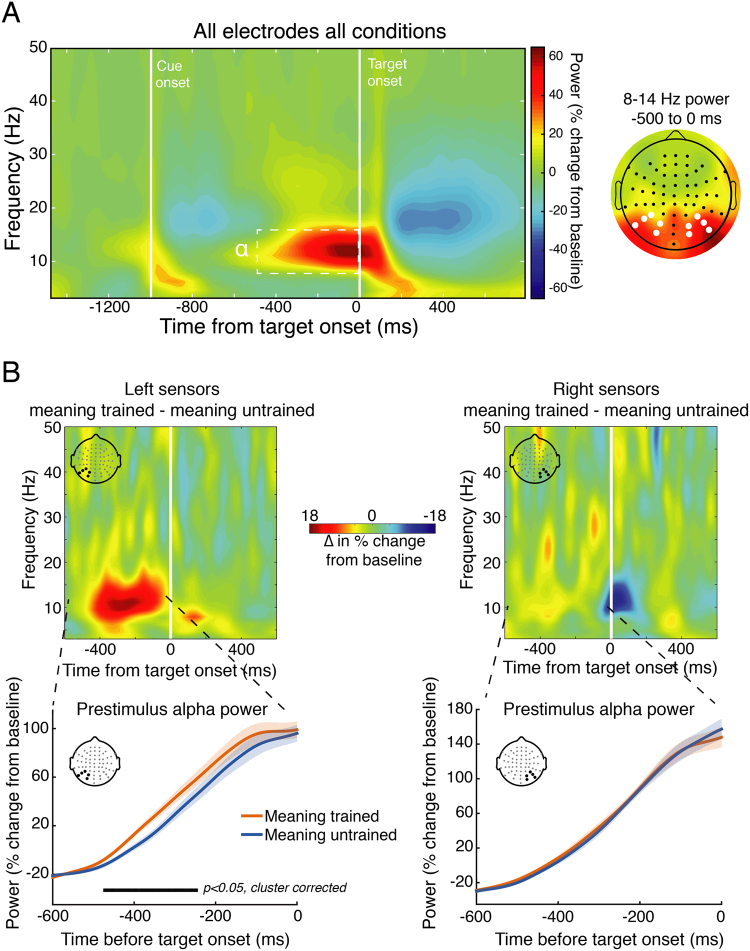
Figure 5.
Time-frequency analysis of alpha-band power during the cue-target interval (Experiment 4). (A) To identify time-frequency-electrode regions of interest while avoiding circular inference, we averaged time-frequency power across all electrodes and conditions. This revealed a prominent increase (~ 65% from baseline) in pre-target (−500 to 0 ms) power in the alpha range (8–14 Hz) that had a posterior topography (right panel; left and right electrode clusters of interest denoted with white dots) associated with simply performing the task. We then focused on how meaning training impacted this signal in subsequent analyses. (B) Time-frequency power plots showing the difference (meaning-trained – meaning-untrained) for left (left panel) and right (right panel) electrodes of interest (derived from panel A) reveal greater alpha power just prior to target onset on meaning-trained trials. The lower panels depict the time-course of the pre-target alpha signal for meaning-trained and untrained trials, revealing a significant temporal cluster of increased alpha power approximately 480 to 250 ms prior to target onset over left, but not right electrode clusters. Shaded regions represent ±1 within-subjects SEM84.

