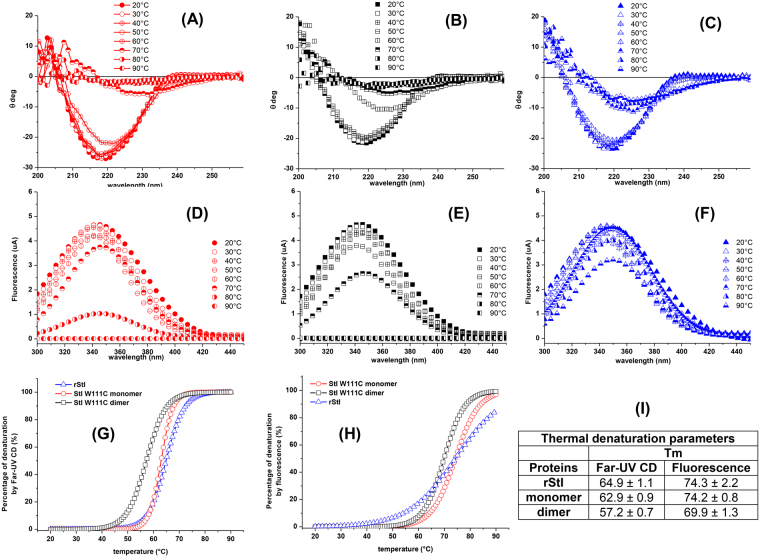
Figure 5.
Thermal unfolding of rStI, StI W111C monomer and dimer forms by by Far-UV CD and fluorescence emission. Far-UV CD spectra of StI W111C monomer (A), dimer forms (B) and rStI (C) were recorded in TBS buffer at 20–90 °C temperature range. Tryptophan fluorescence emission of StI W111C monomer (D), dimer forms (E) and rStI (F) were measured at 334 nm, after excitation at 295 nm, in the same conditions. Protein concentration was 0.05 mg/mL. In each case, the baselines have been subtracted. Thermal dependence of percentage protein denaturation by Far-UV CD (G) and the tryptophan fluorescence emission (H) are depicted. The symbols are as follows: (circles) StI W111C monomer, (squares) dimer and (triangles) rStI. The treatments for the 20–90 °C temperature range are specified in the legend of panel. Melting temperatures (Tm) values (I) correspond to the temperature at the midpoint of the monophasic thermal transition calculated from percentage of change of ellipticity at 220 nm and fluorescence at 334 nm as function of temperature.

