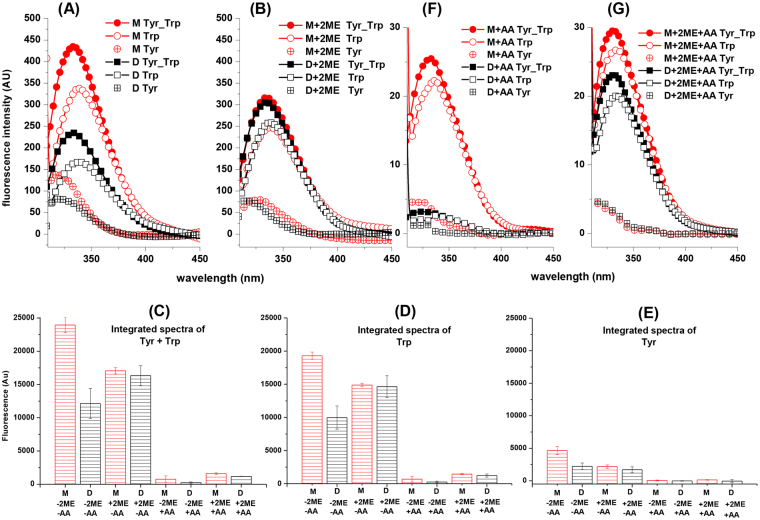
Figure 6.
Fluorescence emission spectra of monomer and homodimer StI W111C forms. Fluorescence emission spectra of Trp and Tyr residues from monomer and dimer forms of StI W111C mutant in solution (A) and pre-incubating the sample with 15 mM 2-mercaptoethanol (2ME) during 24 h (B). The spectra labeled with solid symbols resulted from excitation at 275 nm (Trp and Tyr contribution) and the spectra labeled with open symbols resulted from specific excitation of Trp at 295 nm (Trp contribution). Trp spectra were normalized multiplying each fluorescence intensities by the ratio between the emission intensities of Trp/Tyr and the Trp spectra at 380 nm, in which the emission of Tyr does not occur. Tyr spectra (open symbols and cross) were obtained by subtracting the Trp-normalized spectra and spectra of protein with excitation at 275 nm (Trp and Tyr contribution). Panels (C–E) show the integrated spectra values from Trp-Tyr, Trp and Tyr contributions, respectively. All spectra were recorded at 1 µM of protein concentrations and fluorescence emission is proportional in all cases but expressed in arbitrary units. The following labels, colors and symbols represent the different protein samples: monomer (M-2ME-AA, red, circle) and dimer (D-2ME-AA, black, square) forms in solution; monomer (M + 2ME-AA, red, circle) and dimer (D + 2ME-AA, black, square) forms in solution pre-incubated with 2ME; monomer (M-2ME + AA, red, circle) and dimer (D-2ME + AA, black, square) forms in solution quenched with 300 mM of acrylamide (AA); and monomer (M + 2ME + AA, red, circle) and dimer (D + 2ME + AA, black, square) forms in solution pre-incubated with 2ME and quenched with 300 mM of acrylamide (AA). Fluorescence maximum emission wavelengths (max) were calculated and shown in Table 2. (F) and (G) are equivalent to panels A and B but the experiments were carried out with 300 mM acrylamide (AA) as quencher.

