Fig. 1.
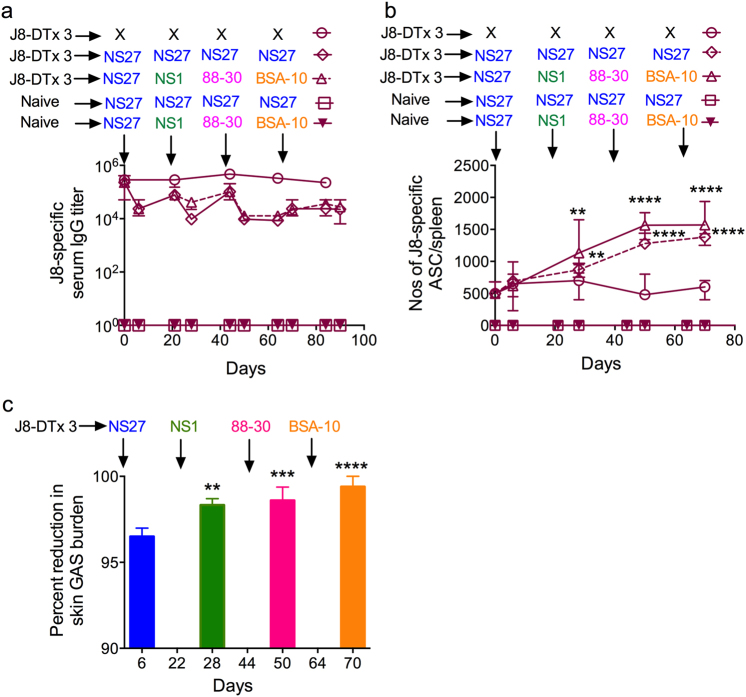
a Effect of J8-DT vaccination on immune responses following multiple sequential GAS infections. J8-DT-vaccinated (s.c. immunization x 3) or naïve BALB/c mice (n = 15/group) were sequentially infected with the same NS27 or four different GAS strains. Vaccinated-uninfected mice were also included. On days 6 and 21 post each infection, sera were collected and J8-specific IgG were measured via ELISA. Sera from the naïve-uninfected mice were used as a control in ELISA. Data are mean ± SEM. b Quantification of antibody secreting cells post vaccination and/or infection. Cohorts of J8-DT-vaccinated or naïve (n = 15/group) mice were sequentially infected multiple times with the same NS27 or four different GAS strains. To assess the development of memory, a designated number of mice were culled on day 6 post each infection and spleens were harvested. The numbers of ASCs specific for J8 were enumerated using ELISPOT. To assess the effect of multiple infections on boosting of ASC response, vaccinated-uninfected mice were used as controls. The data are mean ± SEM. Statistical analysis was performed using one-way ANOVA with Dunnett's multiple comparison test to compare numbers of ASCs post first infection with numbers of ASCs following each sequential infection. **p < 0.01 and ****p < 0.0001. c Protective efficacy of J8-DT following sequential infections with multiple GAS strains. Cohorts of BALB/c mice (n = 20–25/group) were immunized subcutaneously with J8-DT/Alum. Two weeks post last immunization mice were sequentially infected with four different GAS strains (NS27, NS1, 88-30, and BSA-10) via the skin. For each infecting GAS strain, naïve mice were also included as a challenge control. Each sequential infection was 3 weeks apart. On day 6 post infection, five mice each from immunized and control groups were sacrificed and skin samples collected to determine bacterial burden. Percent reduction in skin bacterial burden was calculated by taking into account the corresponding naïve challenge controls and is shown as mean ± SEM. The GAS burden (mean CFU) in control mice ranged between 747,800 and 915,280. Statistical analysis was performed using one-way ANOVA with Dunnett’s multiple comparison test to compare percent reduction in GAS burden post first infection with percent reduction in GAS burden following each sequential infection. **p < 0.01, ***p < 0.001, ****p < 0.0001

