
Figure 4. Representative photomicrographs of paraffin sections after PAS/Alcian Blue staining.
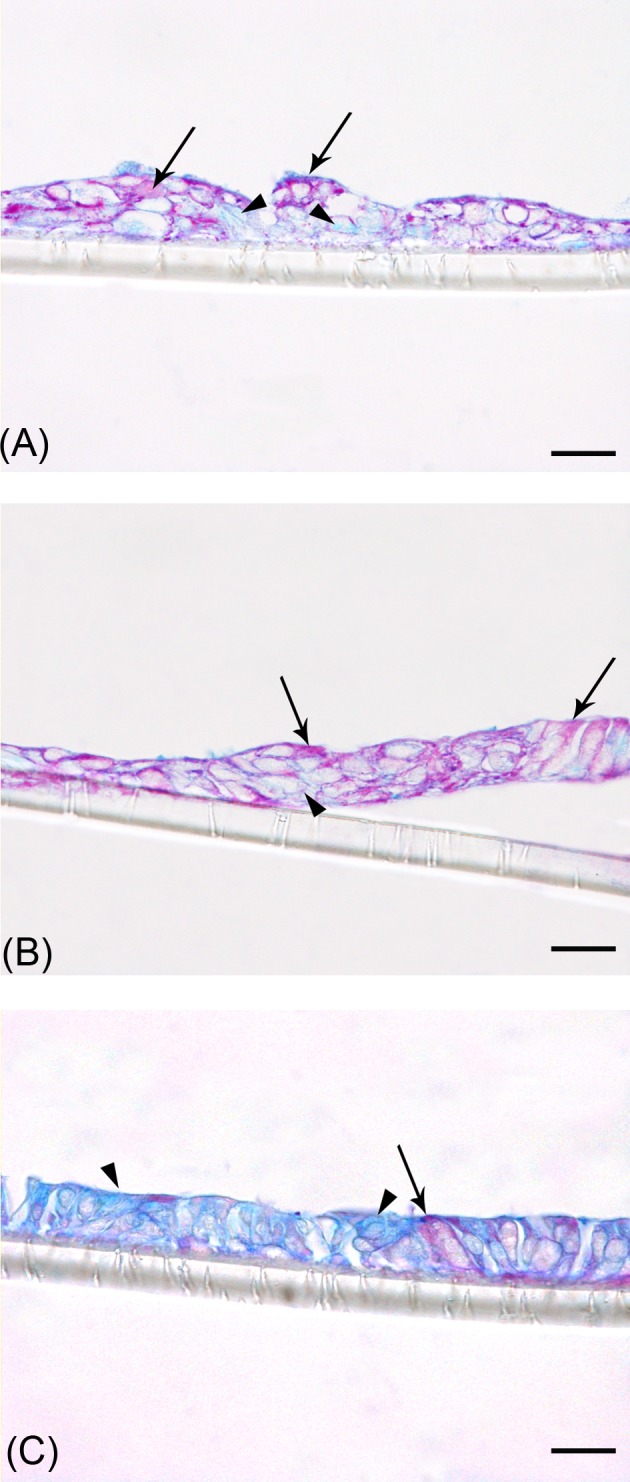
(A) Parental Caco2 RPMI cells at T14; (B) 70/30 co-culture cells at T6; (C) 70/30 co-culture cells at T14. Black arrows indicate cells stained with PAS/Alcian Blue; arrowheads indicate unstained cells. Bars: 10 µm.