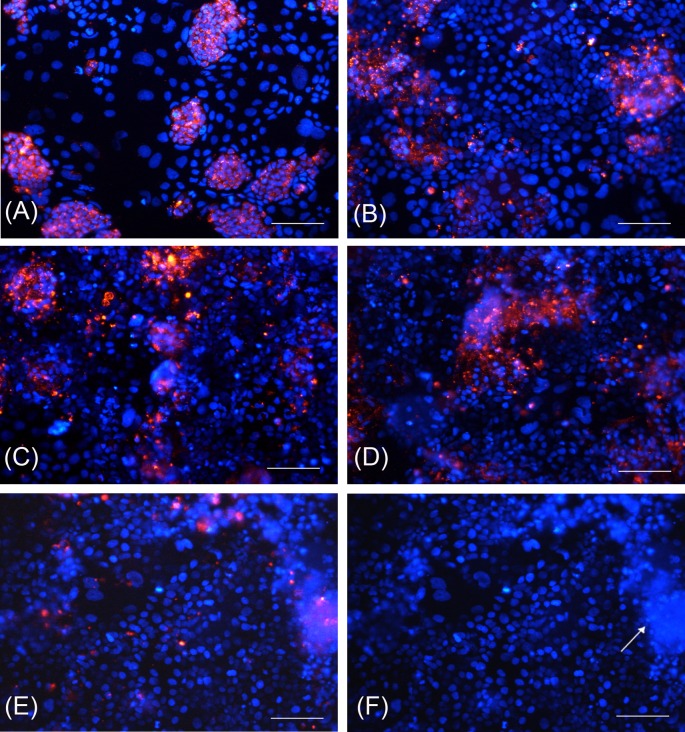
Figure 7. HT-29 cell staining and nuclei identification in 70/30 co-culture at different post-confluence days.
(A) T0 cells; (B) T3 cells; (C) T6 cells; (D) T10 cells; (E) T14 cells; (F) domes formed by HT-29 cells at T14. Red fluorescence: HT-29 cells marked with PKH26 GL; blue fluorescence: nuclei counterstained with DAPI. White arrow indicates domes. Bars: 100 µm.

