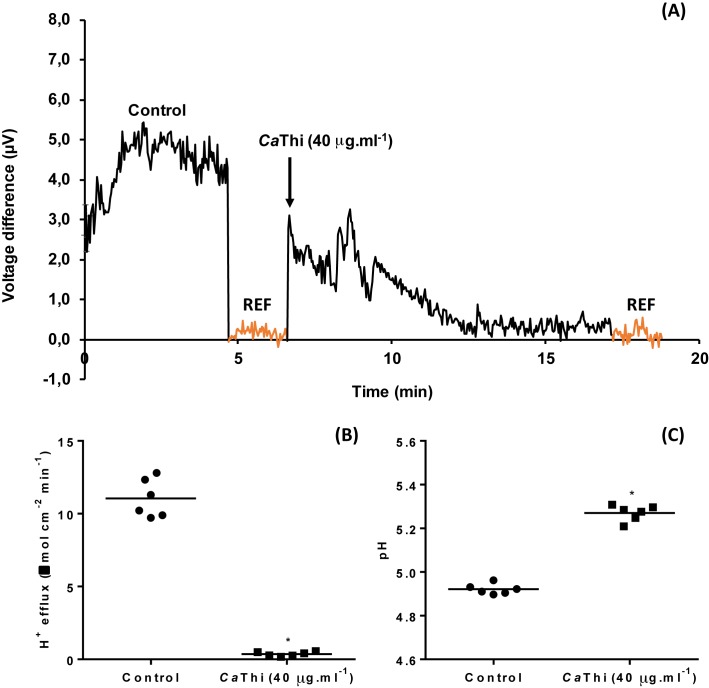
Figure 5. Dose–response curve of the effects of CaThi peptide on extracellular voltage difference (A), proton (H+) fluxes (B), and cell surface pH (C) in the C. tropicalis yeast.
For H+ effluxes and pH data, means are significantly different by Student t test at P≤0.01 indicated by ‘*’. REF represents the background reference.

