Figure 6. Dose–response curve of the effects of CaThi peptide on extracellular pH and H+ efflux in the C. tropicalis yeast.

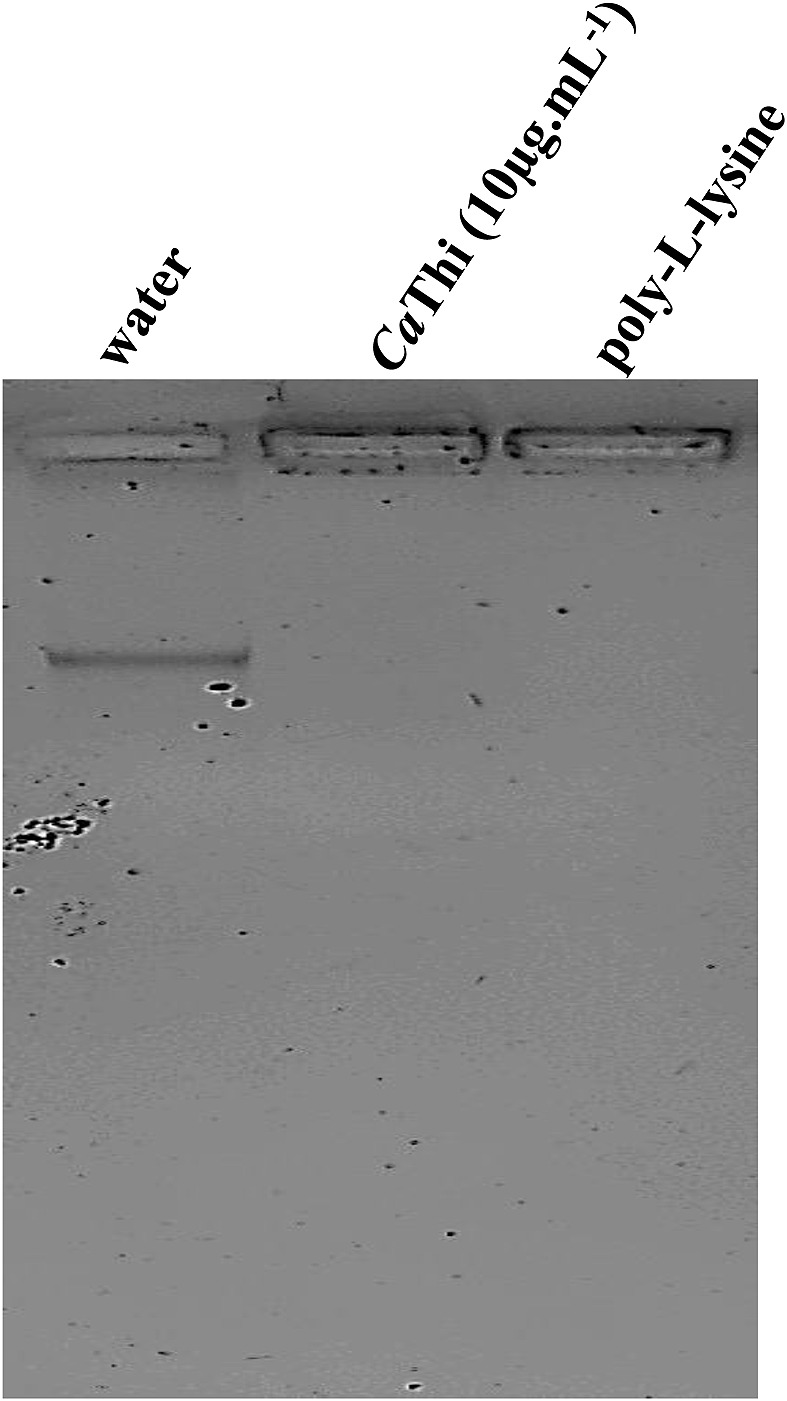
First line, control, mobility of 100 ng of DNA and binding buffer. Second line, mobility of 100 ng DNA incubated with 10 μg.ml−1 of CaThi. Third line, positive control, mobility of 100 ng of DNA incubated with 10 μg.ml−1 of poly-l-lysine.
