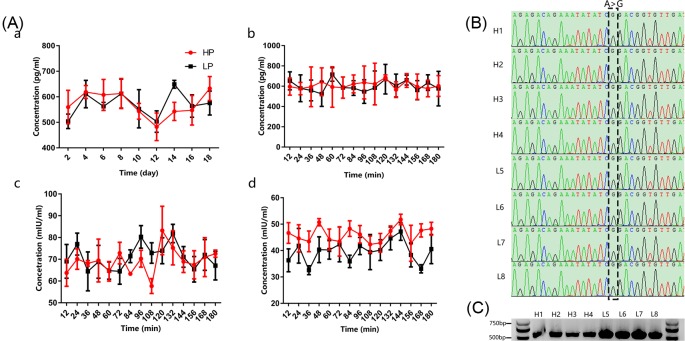
Figure 1. Changes in the concentrations of reproductive hormones and BMPR-1B mutations in HP and LP Hu sheep.
(A) The black and red lines represent data for the HP and LP Hu sheep, respectively. (a) Changes in the E2 concentration during the estrous cycle; (b) changes in the E2 concentration during intensive blood collection; (c) changes in the FSH concentration during intensive blood collection; (d) changes in the LH concentration during intensive blood collection. (B) Sequencing results for eight ewes. In eight ewes, the CAG site in exon 6 of BMPR-1B amplification products were CGG. (C) Representative PCR for the BMPR-1B gene performed on samples of every ewe.

