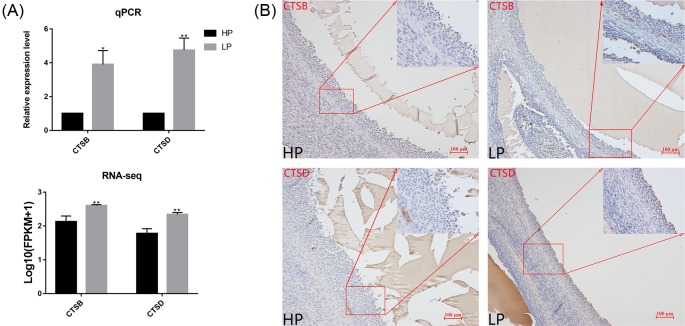
Figure 7. The pattern of CTSB and CTSD expression in the ovaries.
(A) The relative expression level of CTSB and CTSD as determined by qRT-PCR, and the RNA-seq data of CTSB/CTSD relative expression, normalized by log10 (FPKM + 1). Comparisons were made using independent-sample t test, with SPSS 24.0. *: P<0.05; **: P<0.01. CTSB and CTSD primers are shown in Supplementary Table S1. (B) Representative immumohistochemical staining for CTSB and CTSD in the ovaries of HP and LP ewes. CTSB and CTSD proteins were both positively expressed in granulosa cells.

