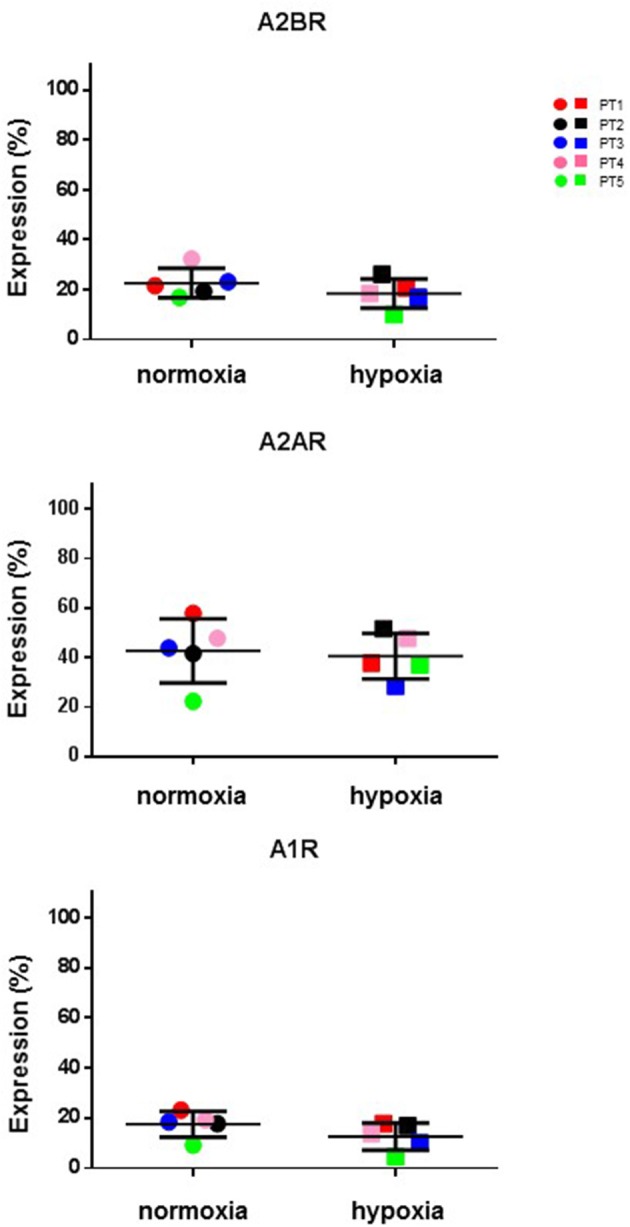
Figure 7.

Expression of P1 receptors in normal and hypoxic conditions. Comparative cytofluorometric analysis of A1R, A2AR and A2BR expression in CIK cells stained with primary antibodies to various P1 receptors and detected with fluorescein (FITC)-conjugated secondary antibodies as reported in Materials and Methods. To compare data obtained in hypoxia and normoxia we used unpaired nonparametric test, two-tailed Mann-Whitney for GraphPad Prism 6. Circles, normoxia; squares, hypoxia. Patients are as following: PT1, red; PT2, black; PT3, blue; PT4, pink; PT5, green. Reported data are expressed as mean values ± SD.
