
Figure 1.
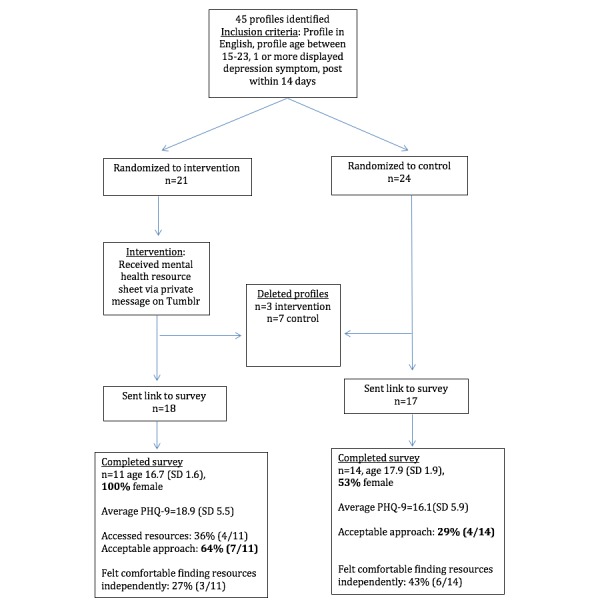
Flowchart of study design. P values calculated using an unpaired t test. Bolded values indicate significant values. PHQ-9: Patient Health Questionnaire-9.
Official websites use .gov
A
.gov website belongs to an official
government organization in the United States.
Secure .gov websites use HTTPS
A lock (
) or https:// means you've safely
connected to the .gov website. Share sensitive
information only on official, secure websites.
Flowchart of study design. P values calculated using an unpaired t test. Bolded values indicate significant values. PHQ-9: Patient Health Questionnaire-9.