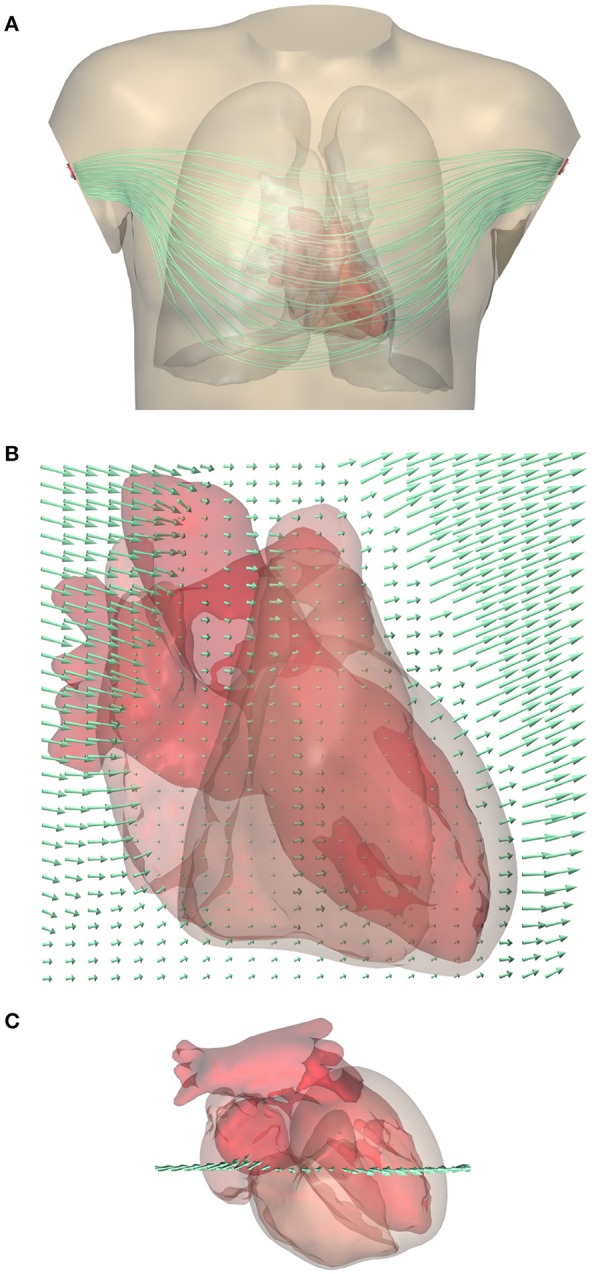
Figure 2.

(A) Computed lead field for standard lead I (between the two arm electrodes) shown using streamlines that represent the direction of ∇Z. Note that they do not represent the current (Gi+Ge)∇Z. For a clear visualization the lines were seeded at a selection of points in and near the heart; variations in field strength perpendicular to the lines cannot be read from this figure. A rotating display is provided in a Supplementary File. (B) Close-up of the lead field on a grid in a frontal plane crossing the heart. The arrow length shows the strength of the field, |∇Z|, at the tail of the arrow. Field strength is small in the highly conductive blood inside the ventricles, and very large in the low-conductivity lungs, while it has an intermediate value in the cardiac muscle and in the abdomen. (C) Superior view of the heart showing the location of the grid.
