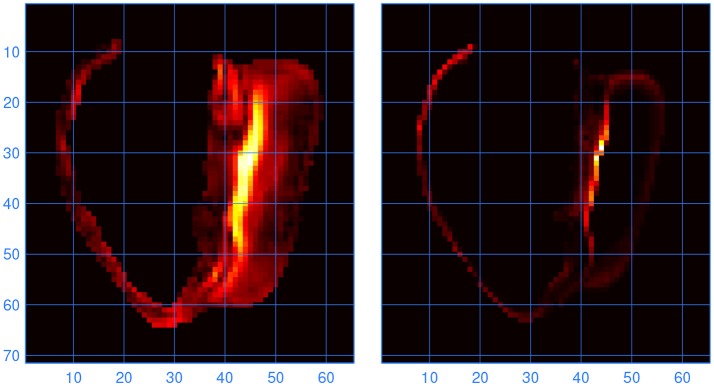
Figure 6.
(Left) Norm of the difference between the lead vector fields computed with LFS(0.2, 1) and LF(1, 1). Brighter colors indicate higher values; the units are arbitrary. The cross section is through the inferior septal junction, parallel to the standard long-axis plane. The cavity on the left side of the image is the bulbus region of the right ventricle. (Right) Variability in fiber direction, also in arbitrary units, in the same cross section. The scales are in millimeters.

