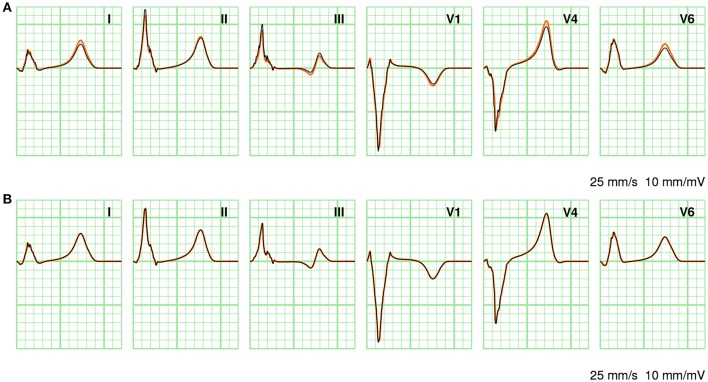
Figure 7.
Comparison of ECGs between different computation methods. (A) Full solutions at 0.2 mm (orange) and 1.0 mm (black). (B) Full solution at 0.2 mm (orange) and LFS(0.2, 2). The standard limb leads I, II, and III as well as three standard precordial leads V1, V4, and V6 are shown. Vertical grid lines are 40 ms apart and horizontal grid lines are 0.1 mV apart.

