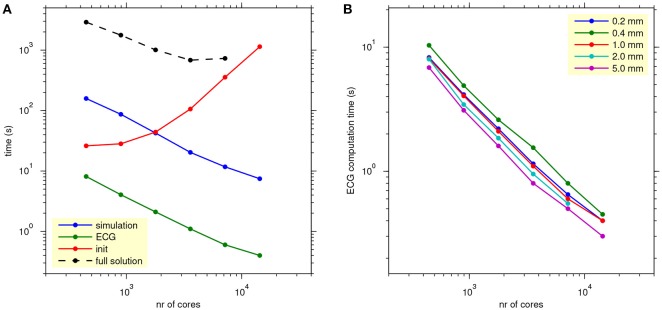
Figure 8.
(A) Scaling of propagation, lead-field ECG, and full solution. The blue, green, and red traces show average simulation time, ECG computation time, and initialization time for reaction-diffusion simulations run on 16–512 nodes (448–14,336 cores) with 4 threads per process, with ECG computation based on a lead field at 1.0 mm resolution. The black trace shows the time for a full bidomain solution. Each data point represents an average over 5 simulations. (B) As (A), but showing only ECG computation time, for all lead-field resolutions.

