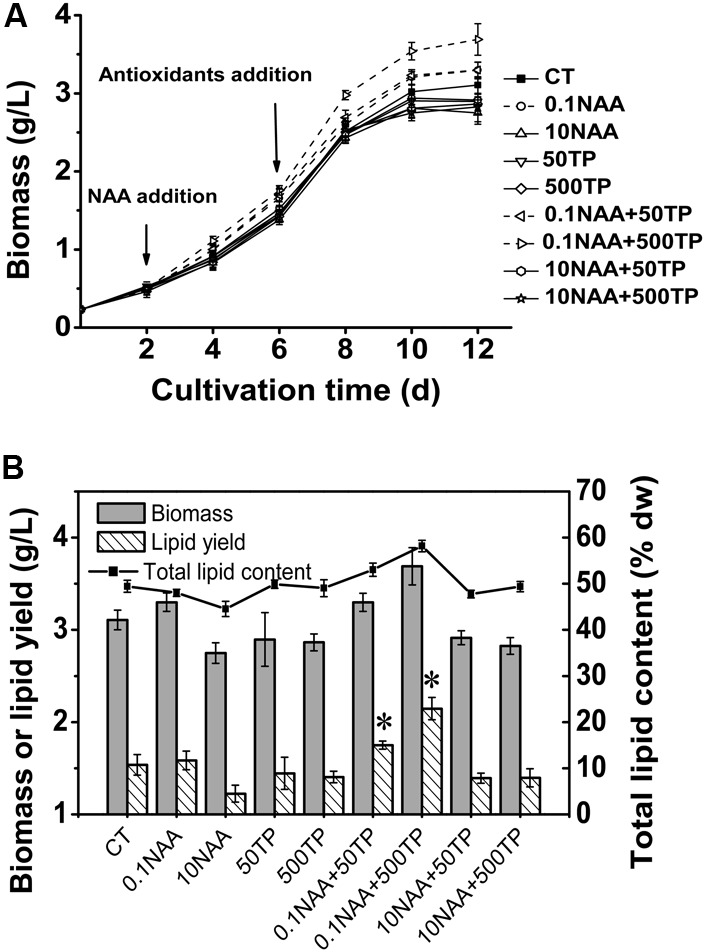
FIGURE 2.

Growth and lipid content of M. afer supplemented with NAA and TP. (A) Growth curves of M. afer that grew under different treatment of additive combinations. CT is the control group without additives. NAA and TP were added at day 2 and day 6, respectively. (B) Final algal biomass (dry weight), lipid content (% dry weight), and lipid yield of M. afer under different culture conditions. Values are means ± SE (n = 3). Asterisks indicate statistically significant differences compared with the control group (∗p < 0.05; ANOVA).
