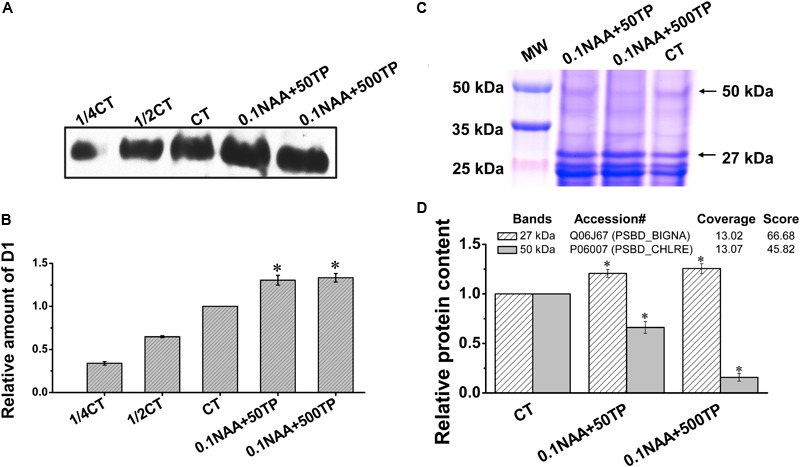
FIGURE 5.

Quantification analysis of photosynthetic proteins of M. afer under different culture conditions. (A) Western-blot analyses of D1 protein under different culture conditions. Thylakoid membrane proteins were separated by 12% SDS-PAGE and subsequently probed with D1 antibody. Thylakoid samples were loaded on the basis of equivalent total protein content (15 μg) in each lane. 1/4 CT and 1/2 CT: a fourfold and twofold dilution of extract of control group. (B) The amounts of D1 in M. afer harvested from different culture conditions were calculated based on the gray analysis of western-blot by Image J software. (C) Isolated thylakoid membrane proteins under different culture conditions on SDS-PAGE. Thylakoid samples were loaded on the basis of equivalent total protein content (15 μg) in each lane. (D) Semi-quantification analysis of two target bands (27 and 50 kDa) according to their gray scale. Values are means ± SE (n = 3). The insert table showed the protein predicted by LC–MS/MS. Asterisks indicate statistically significant differences compared with the control group (∗p < 0.05; ANOVA).
