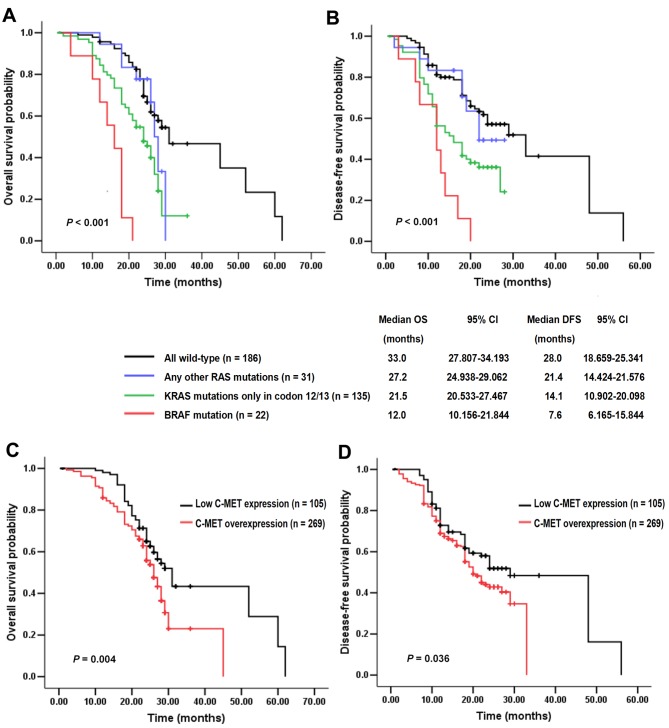
Figure 3.
Kaplan-Meier survival curves of patients with stage III colorectal carcinoma. (A) OS and (B) DFS in all wild-type vs. RAS/BRAF mutations. (C) OS and (D) DFS in low C-MET expression vs. C-MET overexpression of entire study population. OS, overall survival; DFS, disease-free survival; C-MET, c-mesenchymal epithelial transition factor; CI, confidence interval.

