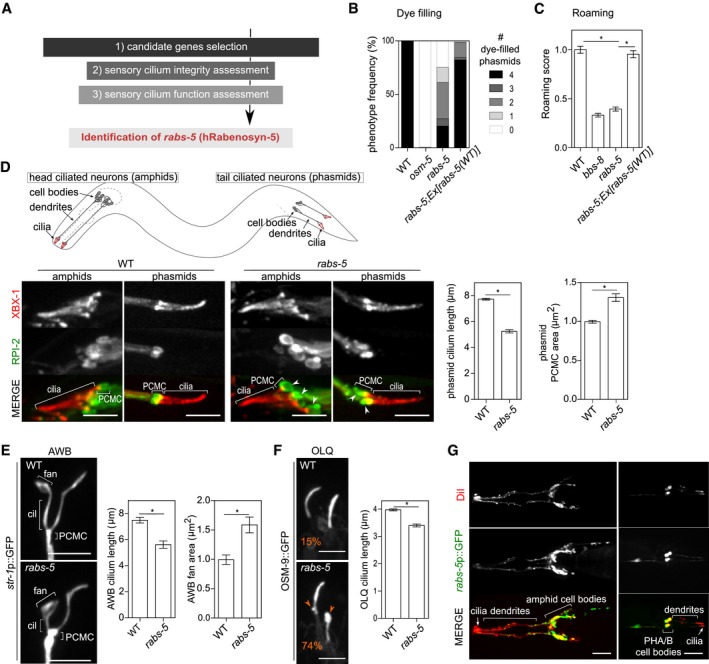
Flow chart of reverse genetic screen to identify ciliary membrane homeostasis regulators.
Quantification of DiI uptake in the phasmid neurons of the indicated genetic backgrounds. In each case, the number (0–4) of phasmid neurons taking up dye is scored. osm‐5(p813) used as positive control. Bars show phenotype frequency (%) from four independent experiments (n > 35 per experiment).
Quantification of roaming behaviour for the indicated genetic backgrounds. bbs‐8(nx77) used as positive control. Bars show roaming score as mean ± SEM (n = 60). *P < 0.001 (unpaired Student's t‐test; vs. WT or rabs‐5).
Representative images (Z‐projects) and quantification of cilium length and PCMC area in WT and rabs‐5(ok1513) worms expressing XBX‐1::tdTomato (labels the ciliary axoneme) and RPI‐2::GFP (labels the PCMC membrane; excluded from the ciliary membrane). White arrowhead indicates PCMC expansions. Bars in graphs show mean ± SEM (n = 60). *P < 0.001 (unpaired Student's t‐test; vs. WT). Schematic shows location and organisation of amphid and phasmid ciliated neurons in C. elegans. Anterior is to the left (images). Scale bars = 5 μm.
Representative images (Z‐projects) and quantification of AWB cilium branch length and fan area in WT and rabs‐5(ok1513) worms expressing a soluble GFP reporter (str‐1p::gfp). Bars show mean ± SEM values (n = 30). *P < 0.001 (unpaired Student's t‐test; vs. WT). Anterior is to the top (images). Cil, ciliary axoneme. Scale bars = 5 μm.
Representative images (Z‐projects) and quantification of OLQ cilium length in WT and rabs‐5(ok1513) worms expressing the osm‐9::gfp reporter. Bars show mean ± SEM (n = 35). *P < 0.001 (unpaired Student's t‐test; vs. WT). Orange arrowheads indicate bulges in the ciliary membrane, and (%) in panel indicates the phenotype occurrence. Anterior is to the top (images). Scale bars = 3 μm.
Representative images (Z‐projects) of the head and tail regions of WT worms expressing a transcriptional GFP reporter for rabs‐5 (rabs‐5p::gfp) and co‐stained with DiI (stains six pairs of ciliated amphid neurons and the pair of ciliated phasmid neurons). GFP expressed in all dye‐filling neurons. Anterior is to the left. Scale bars = 30 μm.

