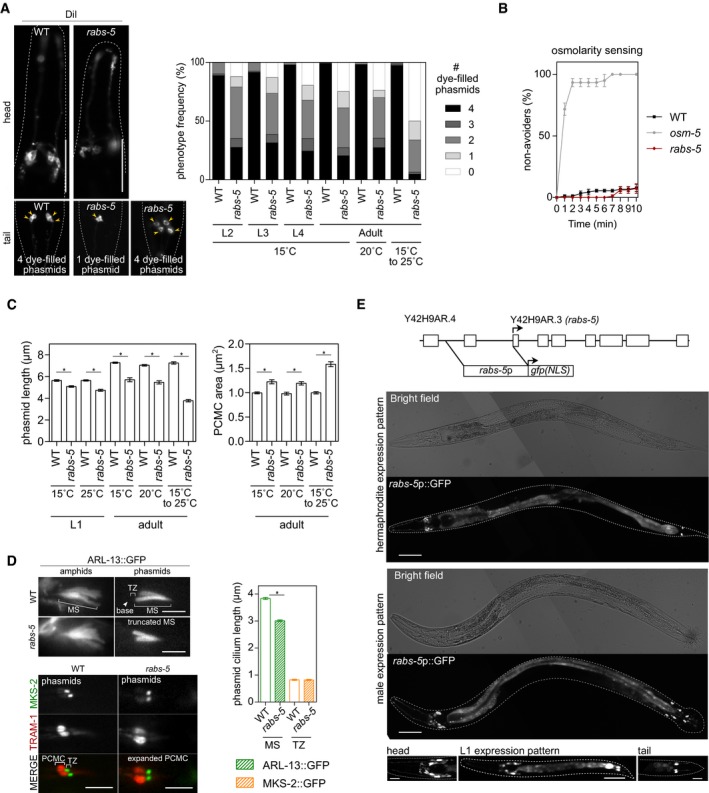
Representative images of the head and tail of WT and rabs‐5(ok1513) worms subjected to a DiI uptake assay. Two extremes of the phasmid dye‐filling phenotype are shown for rabs‐5 worms. Yellow arrowhead indicate dye‐filled phasmid cell bodies. Anterior is to the left. Scale bars = 50 μm. Graph shows quantification of DiI uptake in the phasmid neurons of WT and rabs‐5(ok1513) worms at different larval (L2, L3, and L4) and adult stages, grown at the indicated temperatures (the 15 to 25°C temperature upshift was performed on L4 larvae for 24 h). In each case, the number (0–4) of phasmid neurons taking up dye is scored. Bars show phenotype frequency (%) from three independent experiments (n > 40 per experiment).
Osmotic avoidance phenotype for rabs‐5(ok1513) worms, compared to WT (negative control) and osm‐5(p813) (positive control) worms. Plot shows the fraction of worms that cross a hyperosmotic barrier over 10 min (non‐avoiders). Data in plot represent mean ± SEM values from three independent experiments (n = 30 per condition).
Quantification of phasmid cilium length (XBX‐1::tdTomato) and PCMC (RPI‐2::GFP) area of WT and rabs‐5(ok1513) worms at the indicated developmental stage (L1 and adults) and grown at the indicated temperature (the 15 to 25°C temperature upshift was performed on L4 larvae for 24 h). Bars in graphs show mean ± SEM (n = 45). *P < 0.001 (unpaired Student's t‐test; vs. WT).
Representative images of the amphid and phasmid cilia of WT and rabs‐5(ok1513) worms expressing arl‐13::gfp (stains middle segment, MS) or mks‐2::gfp (stains transition zone, TZ) + tram‐1::tdTomato (stains periciliary membrane compartment, PCMC). Graph shows quantification of ARL‐13 and MKS‐2 signal lengths. Arrowead: ciliary base. Bars show mean ± SEM (n = 45). *P < 0.001 (unpaired Student's t‐test; vs. WT). Scale bars = 2.5 μm (top panels) and 5.0 μm (bottom panels).
Representative fluorescence and bright‐field images of adult (hermaphrodite and male) and L1 larvae (hermaphrodites) expressing a transcriptional reporter for rabs‐5 (rabs‐5p::gfp). Schematic shows the genomic organisation of the rabs‐5 gene and the upstream genomic sequence used for rabs‐5p::gfp. Exons denoted by boxes. Arrow, start codon; NLS, nuclear localisation sequence. Anterior is to the left. Scale bars = 50 μm for adult images; 30 μm (centre image) and 10 μm (left and right images) for L1 images.

