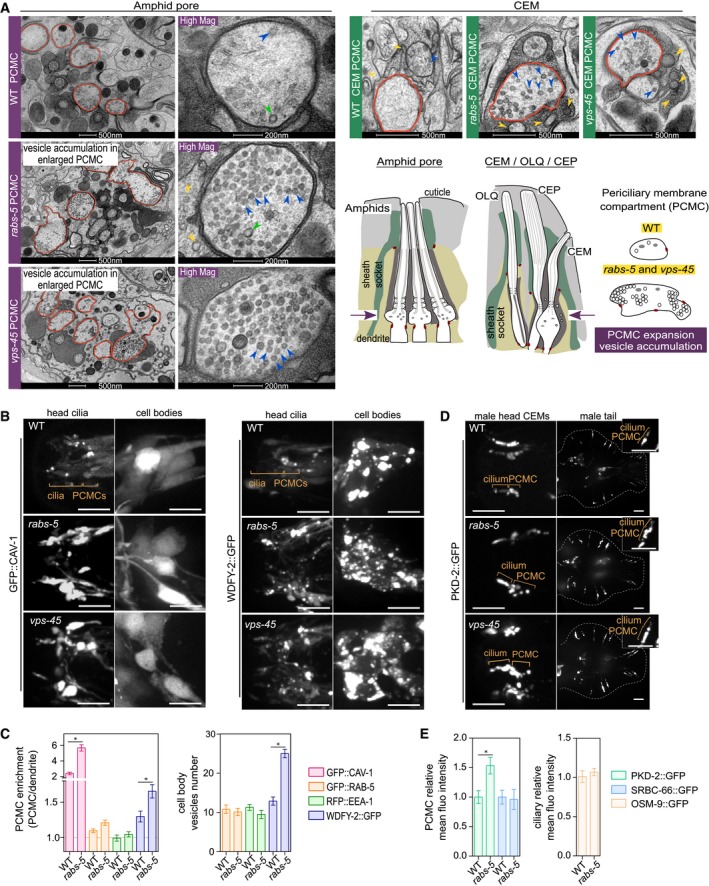
TEM images from thin sections showing PCMC ultrastructure of WT, rabs‐5(ok1513) and vps‐45(tm0246) amphid pores (hermaphrodite) (left) and male‐specific CEM neurons (right). For amphid images, low‐magnification images of the entire pore are shown in the left images; right‐hand images show one representative PCMC at high magnification (Mag). Red outline denotes the PCMCs. Blue arrowheads denote uncoated vesicles. Green arrowheads denote coated vesicles. Yellow arrowheads denote extracellular vesicles in the amphid or cephalic pore. Schematics show the amphid and cephalic (CEP/CEM) channels, as well as the OLQ cilium, in longitudinal section. For simplicity, the cartoon of the amphid pore only shows 3 of the 10 cilia. Arrows in schematics indicate the relative position of the sections shown. Cartoons also show the PCMC phenotype of rabs‐5 and vps‐45 mutants. PCMC, periciliary membrane compartment.
Representative images (Z‐projects) of the head regions of hermaphrodite WT, rabs‐5(ok1513) and vps‐45(tm0246) worms expressing arl‐13p::gfp::cav‐1 or arl‐13p::wdfy‐2::gfp. Images show the ciliary regions (left panels) and the cell bodies regions (right panels). Anterior is to the left. Scale bars = 5 μm.
Quantification of PCMC signal enrichment and cell body vesicle number for the indicated markers (expressed in ciliated cells by arl‐13 promoter sequences) in ciliated neurons of WT and rabs‐5(ok1513) worms. Bars show mean ± SEM (n = 20–30 per condition). *P < 0.01 (nonparametric Mann–Whitney U‐test; vs. WT).
Representative images (Z‐projects) of male head and tail regions in WT, rabs‐5(ok1513) and vps‐45(tm0246) worms expressing pkd‐2::gfp. PCMC, periciliary membrane compartment. Anterior is to the left. Scale bars = 5 and 2.5 μm (high magnification insets).
Quantification of PCMC and ciliary axonemal relative mean intensities for pkd‐2::gfp (expressed in male‐specific neurons), srbc‐66::gfp (expressed in ASK neurons) and osm‐9::gfp (expressed in OLQ neurons of WT and rabs‐5(ok1513) worms. Bars show mean ± SEM (n = 30). *P < 0.001 (unpaired Student's t‐test, vs. WT).

