-
A
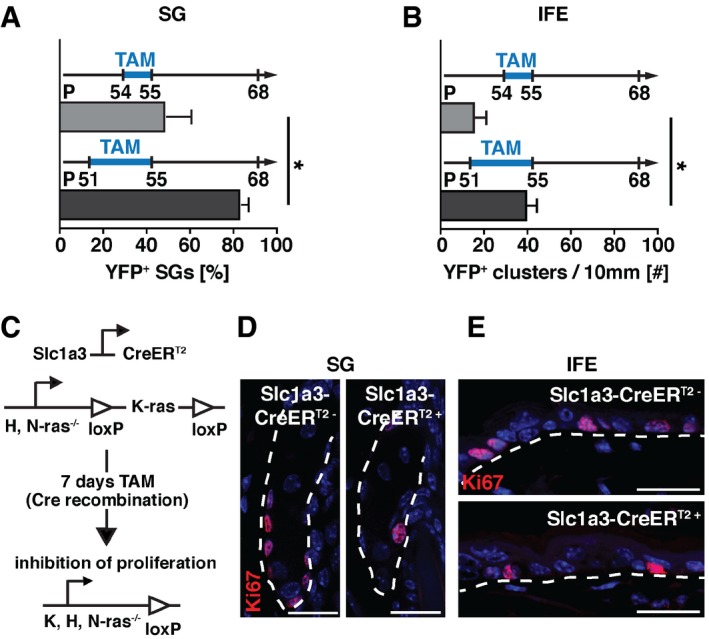
Percentage of YFP+ SGs after 2 (n = 4, 200 SGs) compared to 5 (n = 4, 200 SGs) consecutive days of tamoxifen injection, assessed at the same time during telogen.
-
B
Number of YFP+ cell clusters in 10 mm IFE after 2 (n = 4, 40 mm) compared to 5 (n = 3, 30 mm) consecutive days of tamoxifen injection, assessed at the same time during telogen.
-
C
Schematic depiction of the genetic strategy to block proliferation of Slc1a3+ cells, by tamoxifen inducible cell‐specific deletion of all Ras genes.
-
D, E
Representative micrographs showing proliferating (Ki67+) cells in SG (D) and IFE (E) after recombination‐mediated block of proliferation in Slc1a3+ cells (Slc1a3‐CreERT2+) compared to control (Slc1a3‐CreERT2−) animals.
Data information: Data are mean ± SEM; *
P < 0.05 (two‐tailed Student's
t‐test). Dashed lines outline the SG (B) and indicate the epidermal–dermal border (C). Scale bar = 20 μm.
Source data are available online for this figure.

