
Figure EV3. CdiA toxins induce cefotaxime tolerance in growth‐inhibited cells.
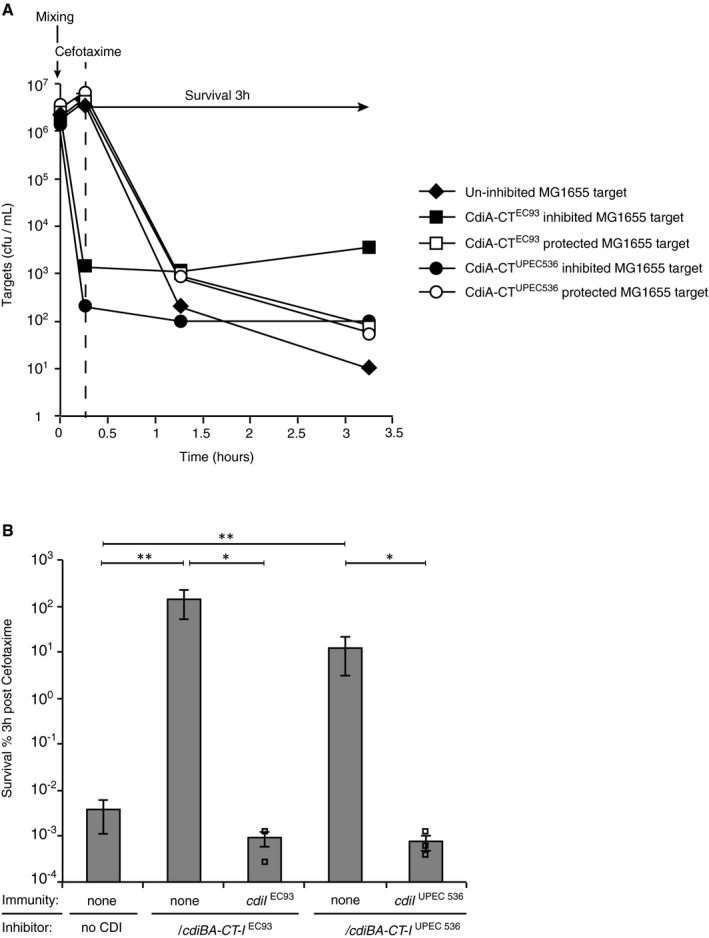
Inhibitor cells with or without CDI loci were mixed with MG1655 target cells with or without cdiI at a 10:1 ratio for 15 min prior to addition of antibiotics (CEF). The number of viable target cells was monitored over time through plating on LB plates supplemented with KAN (measuring target cells only).
- A representative experiment (included in B) where MG1655 cells with (white symbols) or without (black symbols) cognate cdiI were co‐cultured with empty vector (diamonds), plasmid‐encoded cdiBA‐CT‐I EC93 (squares) or with plasmid‐encoded cdiBA‐CT‐I EC93 (circles) cells for 15 min before treatment with CEF. Mixing is indicated by a vertical arrow and survival (plotted in B) by a horizontal arrow. Addition of CEF is indicated with a dashed line.
- Average survival of MG1655 cells with or without immunity to the corresponding toxin (cdiI EC93 or cdiI UPEC536) co‐cultured with empty vector, plasmid‐encoded cdiBA‐CT‐I EC93‐ or cdiBA‐CT‐I UPEC536‐positive inhibitor cells, after 3 h of CIP treatment (n = 5 for empty vector, cdiBA‐CT‐I EC93 and cdiBA‐CT‐I UPEC536, n = 3 for immunity complemented targets).