-
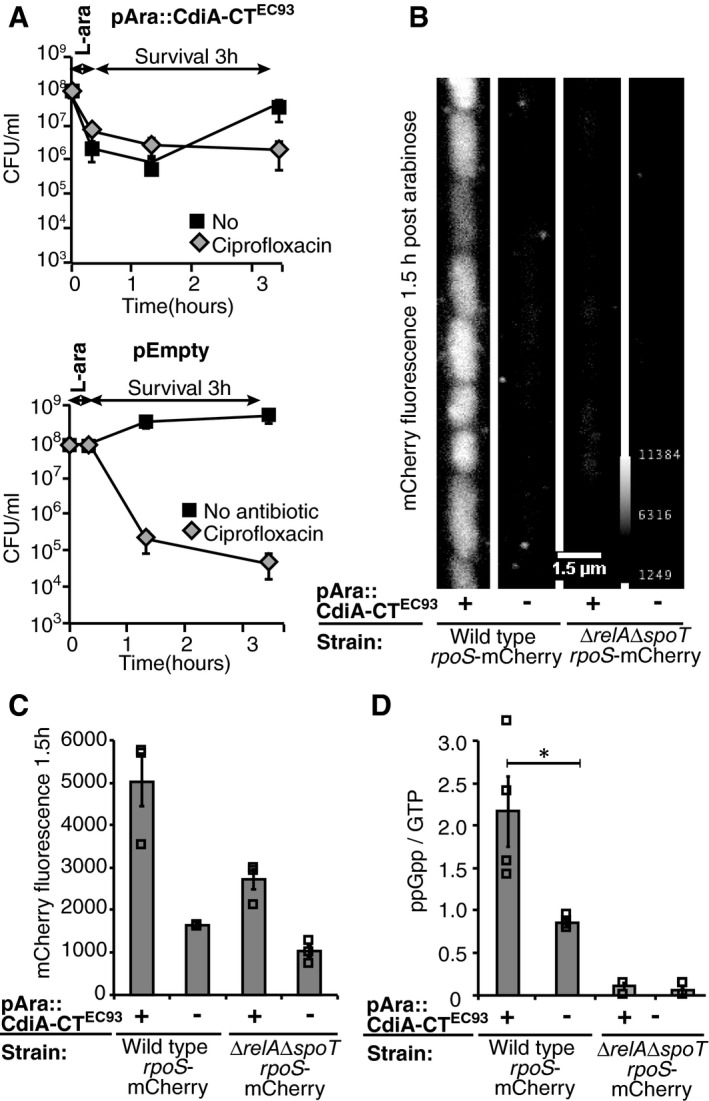
A
Average cfu/ml of MG1655 cells with a chromosomal RpoS‐mCherry fusion and with pAra::CdiA‐CTEC93 (upper graph) or empty vector (lower graph) after 15 min of l‐arabinose induction followed by washing and either no (black squares) or CIP (grey diamonds) treatment (n = 3 and 5 for CIP and no antibiotic series, respectively).
-
B, C
Cells from A were loaded in a microfluidics device after the 15‐min L‐ara induction and mCherry fluorescence was measured using fluorescent microscopy after 1.5 h. (B) A representative image of the wild‐type or ΔrelAΔspoT cells with a chromosomal RpoS‐mCherry fusion grown with empty or CdiA‐CTEC93 vector. Scale bar is 1.5 μm. (C) Average mCherry fluorescence of the wild‐type or ΔrelAΔspoT cells with a chromosomal RpoS‐mCherry fusion grown with empty or CdiA‐CTEC93 vector (n = 3).
-
D
Average ratio of ppGpp/GTP in wild‐type or ΔrelAΔspoT cells with empty or CdiA‐CTEC93 plasmid after l‐arabinose induction (n = 4 and 3 for WT and ΔrelAΔspoT strains, respectively).
Data information: Error bars represent s.e.m. and
n‐values indicate biological replicates. Statistical significance was determined using Mann‐Whitney
U‐test. Scales are logarithmic in (A) and linear in (C, D). *
P < 0.05.
Source data are available online for this figure.