
Figure 1. Structural centrosomal aberrations cause single cell budding from 3D acini.
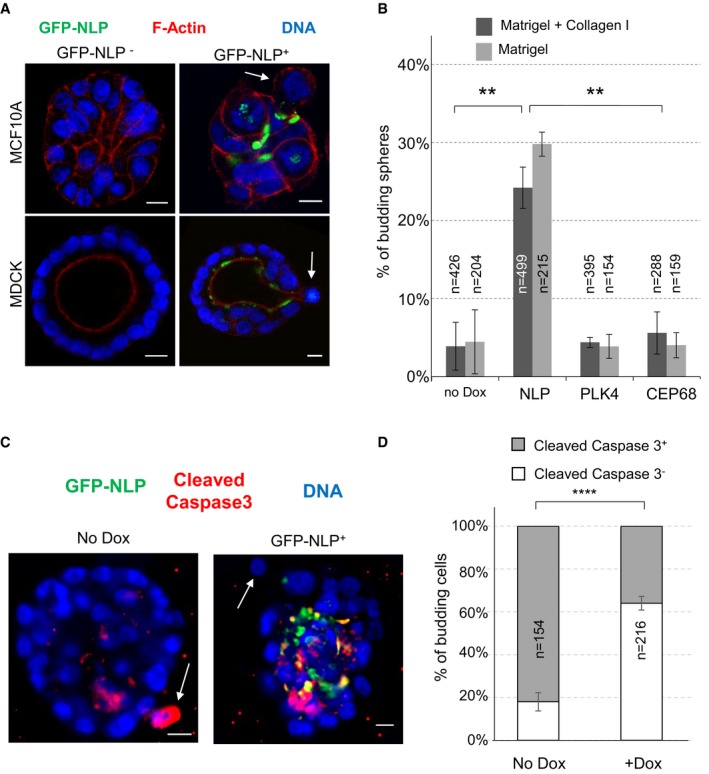
- Representative images show acini derived from MCF10A (upper panels) or MDCK cells (lower panels), with or without induction of GFP‐NLP expression. GFP‐NLP+ and GFP‐NLP− acini were stained for F‐actin (red) and DNA (blue). Arrows point to budding cells. Scale bars = 10 μm.
- Fraction of MCF10A acini that show budding in response to the indicated transgene products (GFP‐NLP, GFP‐PLK4 or GFP‐CEP68), depending on whether acini were cultured in collagen I‐enriched Matrigel (dark gray) or pure Matrigel (light gray); n indicates sample size and error bars indicate ± standard deviation (s.d.) of the mean from three independent experiments. **P < 0.01, as derived from unpaired, two‐tailed Student's t‐test.
- To determine the proportion of apoptotic cells, MCF10A acini expressing GFP‐NLP (+Dox) or not (No Dox) were fixed and stained for cleaved caspase 3. Arrows point to budding cells. Scale bars = 10 μm.
- Fraction of cells budding from MCF10A acini that are positive (gray bars) or negative (white bars) for cleaved caspase 3 staining; data are shown for acini with (+Dox) or without (No Dox) induction of GFP‐NLP expression. n indicates number of budding cells analyzed; error bars indicate ± s.d. of the mean from three independent experiments. ****P < 0.0001, as derived from unpaired, two‐tailed Student's t‐test.