
Figure 3. Centrosome aberrations interfere with the establishment of E‐cadherin junctions through Rac1‐Arp2/3.
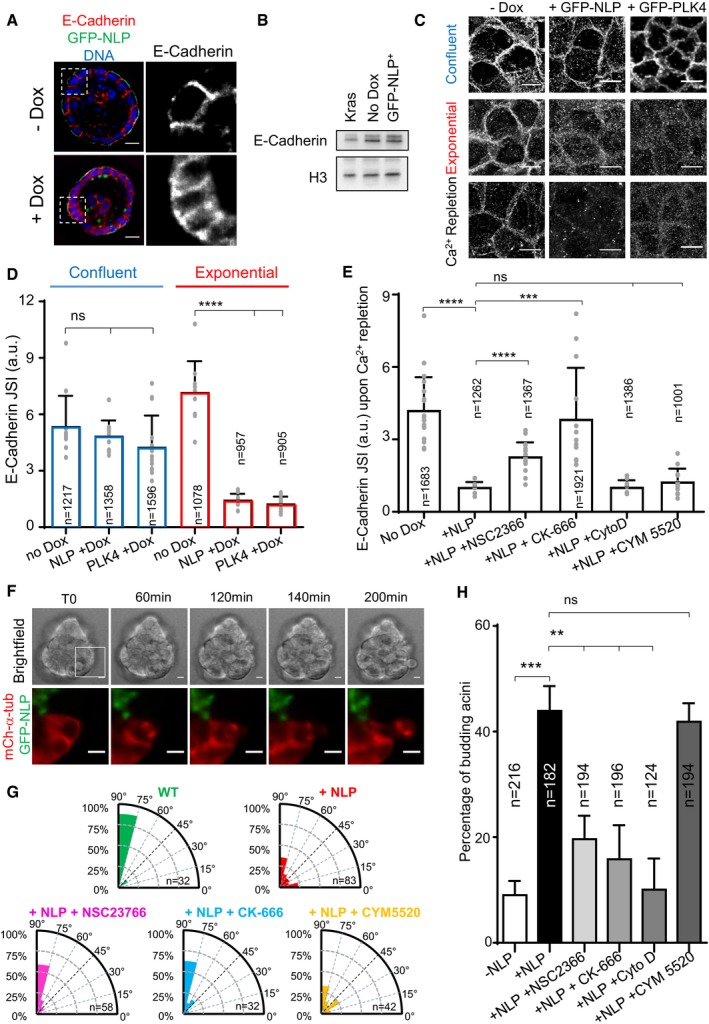
- Representative confocal images showing 8‐day‐old MDCK cysts induced (+Dox) or not (−Dox) to express GFP‐NLP during the last 3 days. Cysts were fixed and stained for E‐cadherin (red) and DNA (blue). Note that GFP‐NLP overexpression induces a broadening of the E‐cadherin signal, as compared to wild‐type cysts. Scale bars = 10 μm.
- Total extracts were prepared from MCF10A monolayer cultures overexpressing GFP‐NLP (GFP‐NLP+), K‐Ras (Kras, for control), or no transgene (No Dox) for 3 days, and analyzed by Western blotting using antibodies against E‐cadherin or histone H3 (loading control).
- Immunofluorescence images show the impact of overexpression of GFP‐NLP or GFP‐PLK4 on E‐cadherin junctions; transgenes were either induced in confluent MDCK cells (upper panels) or in proliferating cells prior to confluence (middle panels). Also shown are images illustrating the impact of GFP‐NLP or GFP‐PLK4 on E‐cadherin remodeling induced by calcium (Ca2+) repletion (lower panels) (for experimental procedure, see Appendix Fig S1). All images are z‐projected stacks of E‐cadherin staining through the entire height of the cells. Scale bars = 10 μm. Note that details on experimental procedures are provided in Appendix Fig S1A. Moreover, larger views of E‐cadherin stainings for non‐induced (No Dox) or GFP‐NLP‐expressing cells (GFP‐NLP) in confluent cultures and after Ca2+ repletion are shown in Appendix Fig S1B.
- Histogram represents the E‐cadherin junction strength index (JSI), as defined in Appendix Fig S1, for MDCK cells induced to express GFP‐NLP (NLP +Dox), GFP‐PLK4 (PLK4 +Dox), or neither transgene (No Dox) during confluence or exponential growth (corresponding to C); bars represent the means of three independent experiments + s.d. and n the numbers of cells analyzed; the values obtained for each field are plotted on the graph. P‐values were derived from unpaired, two‐tailed Student's t‐test. ns indicates not significant, and ****P‐values of < 0.0001.
- Histogram shows the E‐cadherin JSI for calcium repletion experiments performed on confluent MDCK cells expressing GFP‐NLP (+NLP) or not (No Dox), and treated with or without the indicated compounds: NSC2366, inhibitor of Rac1; CK‐666, inhibitor of Arp2/3; cytochalasin D (CytoD), inhibitor of actin polymerization; CYM5520, an agonist of S1PR2. Bars represent the means of three independent experiments + s.d. and n the numbers of cells analyzed; the values obtained for each field are plotted on the graph. P‐values were derived from unpaired, two‐tailed Student's t‐test. ns indicates not significant; ***P < 0.0005 and ****P < 0.0001, respectively.
- Still series from time‐lapse experiment showing extensive rotation of the mitotic spindle during budding from an MCF10A acinus stably expressing mCherry α‐tubulin (red) and induced to express GFP‐NLP (green). Upper panels show bright field images and lower panels the corresponding enlarged fluorescence images as defined by the white square drawn on the bright field image T0 (see Movie EV6). Scale bars = 10 μm.
- Radial histograms illustrate the distributions of the acute angle between the mitotic spindle axis and the radius of the cyst for the different conditions on fixed samples. n represent the number of mitoses analyzed. Note that data for NLP+ cysts include both GFP‐NLP− and GFP‐NLP+ mitotic cells, as results for these two subclasses were virtually indistinguishable. This confirms that spindles rotate in both GFP‐NLP+ and GFP‐NLP− mitotic cells budding from NLP+ cysts (as illustrated in panel F).
- Fraction of budding acini in response to the indicated treatments. Bars represent means + s.d. and n the number of acini from three independent experiments. P‐values were derived from unpaired, two‐tailed Student's t‐test. ns indicates not significant; **P < 0.005 and ***P < 0.0005, respectively.