
Figure 4. NLP overexpression sequesters microtubule minus‐ends and stabilizes microtubules.
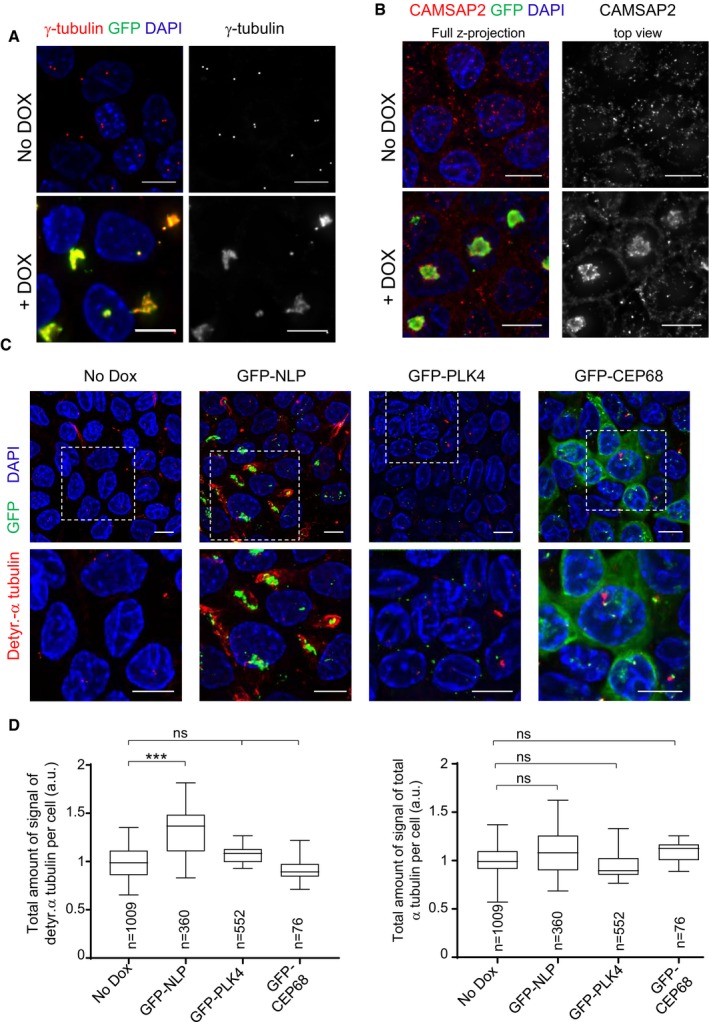
- Representative immunofluorescence images of MDCK cells show that aberrant centrosomes triggered by doxycycline‐induced GFP‐NLP overexpression (green; lower panels) over‐recruit γ‐tubulin (red), as compared to uninduced (No Dox) cells (upper panels). DNA was stained with DAPI. Scale bars = 10 μm.
- Representative immunofluorescence images show of MDCK cells that aberrant centrosomes triggered by doxycycline‐induced GFP‐NLP overexpression (green; lower panels) sequester the microtubule minus‐end‐binding protein CAMSAP2 (red), as compared to uninduced (No Dox) cells (upper panels). DNA was stained with DAPI. Scale bars = 10 μm.
- Representative immunofluorescence images of MDCK cells show that structural centrosome aberrations induced by GFP‐NLP overexpression (green), but not numerical aberrations induced by GFP‐PLK4 overexpression (green), trigger microtubule stabilization, as revealed by increased staining for detyrosinated α‐tubulin (red). Non‐induced cells (No Dox) or cells induced to express GFP‐CEP68 (which triggers no detectable centrosome aberrations) are shown for control. DNA was stained with DAPI. Dashed white squares mark the regions chosen for blow ups shown below each image. Scale bars = 10 μm.
- Histograms show the quantification of detyrosinated‐α‐tubulin (left) and total α‐tubulin (right) per cell, as deduced from analysis of immunofluorescence signals. Data are compiled from MDCK cells induced to express GFP‐NLP, GFP‐PLK4, GFP‐CEP68, or the corresponding non‐induced cells (No Dox). n indicates the number of cells analyzed in two independent experiments. Box plots show the mean (square) and median (line); whiskers are s.d. and the box is s.e.m. Statistical significance was tested using a Mann–Whitney test. ***P < 0.005; ns indicates not significant.