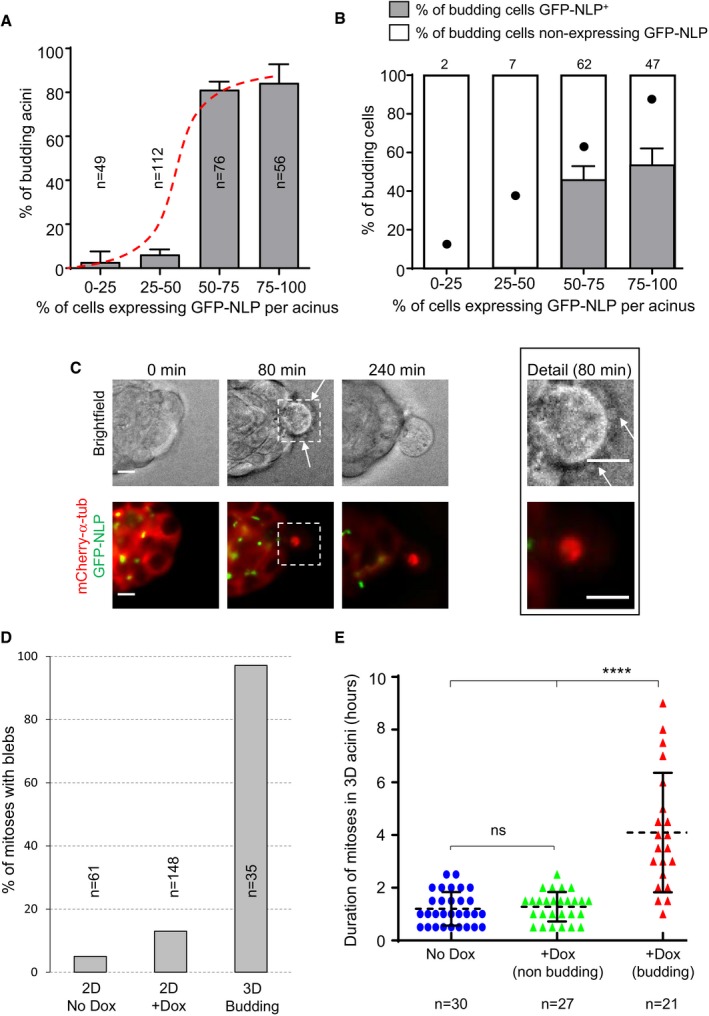
Fraction of budding MCF10A acini as a function of the estimated percentage of GFP‐NLP+ cells. Acini were grouped into four classes, depending on the percentage of GFP‐NLP+ cells within each acinus. As illustrated by the sigmoidal curve (red dashed curve), the frequency of budding is not proportional to the percentage of GFP‐NLP+ cells within each group, but instead requires a threshold (> 50%) above which budding occurs with high frequency. Bars represent the means of four independent experiments + s.d. (totally 293 acini; the number of acini analyzed for each class is indicated in each bar).
Histogram distinguishes budding cells for each class (as in A) according to whether or not they express GFP‐NLP. Each bar indicates the percentage of budding cells that lack a detectable GFP‐NLP signal (white) as well as the percentage of GFP‐NLP+ cells (gray). For calibration, filled dots indicate the percentages of GFP‐NLP+ budding cells that would be expected if budding occurred in proportion to the average frequency of such cells in the acini of the corresponding class (e.g., 12.5% for the class 0–25, 87.5% for the class 75–100). Bars represent the means of four independent experiments + s.d. Data were compiled from 293 MCF10A acini (as in A) displaying at least one budding event (totally 118 budding cells). Absolute numbers of budding cells for each class are indicated above each bar. Note that budding was a very rare event for the acini showing fewer than 50% of GFP‐NLP‐positive cells (see A), and therefore, the numbers of budding cells were also very small. Regarding the acini expressing more than 50% of NLP‐positive cells, two‐tailed Student's t‐tests confirm the statistical significance of the observed bias in favor of dissemination of GFP‐NLP‐negative cells, yielding P < 0.001 and < 0.005 for the acini classes 50–75% and 75–100%, respectively.
Representative stills from time‐lapse recordings show a mitotic cell budding from an MCF10A acinus stably expressing mCherry α‐tubulin (red) and induced to express GFP‐NLP (green). Upper panels show bright field images and lower panels the corresponding fluorescence images; arrows point to membrane blebs. Images were acquired every 20 min, and time stamps are indicated; scale bars = 10 μm.
Fraction of mitotic cells associated with extensive blebbing in different MCF10A populations observed by time‐lapse for 2 days. The graph compares MCF10A cells cultured in a 2D monolayers without (2D No Dox) or after induction of GFP‐NLP expression (2D + Dox) and budding cells from 3D acini (3D Budding). Bars are means of two independent experiments for the 2D cultures and of 16 independent experiments for the 3D acini; n represents the number of mitoses analyzed.
Scatter plot shows the mitotic duration, determined from time‐lapse experiments, of cells dividing within MCF10A acini. The graph compares mitoses in acini without GFP‐NLP induction (No Dox, blue circles) and mitoses within acini expressing GFP‐NLP (+Dox) that either undergo budding (budding, red triangles) or not (non‐budding, green triangles). Error bars represent ± s.d. of the means, and n shows the numbers of mitoses analyzed. Statistical significance was tested using a Mann–Whitney test. ****P < 0.0001; ns indicates not significant.