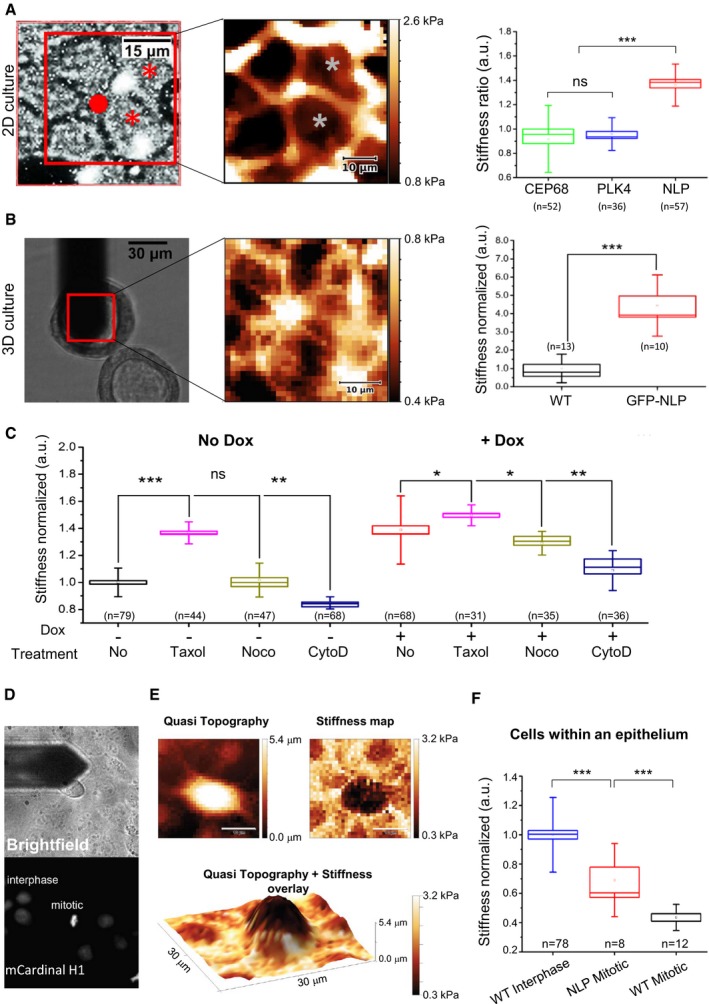
AFM performed on MDCK cells cultured in 2D. (Left) Example of epifluorescence microscopy image; cells harboring structural centrosome aberrations (GFP‐NLP) are marked (asterisks). The scan area (red square) and position of the AFM probe (red dot) are monitored in the bright field signal for each experiment. (Middle) Stiffness map visualizes local nanomechanical heterogeneities. As seen in epifluorescence, corresponding cells that overexpress GFP‐NLP are marked by asterisks. (Right) Stiffness ratios compare cells overexpressing NLP, PLK4 or CEP68 with neighboring non‐expressing cells (WT), see
Materials and Methods section; NLP overexpressing cells are stiffer than WT cells while cells overexpressing either PLK4 or CEP68 exhibit mechanical phenotypes similar to WT cells.
AFM performed on 3D MDCK cysts. (Left) Bright field image showing the AFM probe positioned above the isolated cyst as marked by the red square. (Middle) Stiffness map recorded within the red square visualizes the basal surface of individual cells. (Right) Quantitative analysis confirms that NLP overexpression induces cell stiffening in 3D.
Drug‐induced changes of cytoskeletal structures alter cellular stiffness of WT (No Dox) or GFP‐NLP+ (+Dox) MDCK cells in 2D.
Cell cycle dependence of cellular stiffness. Position of the AFM probe is monitored in the bright field signal (top) while corresponding detection of condensed chromatin mCardinal‐histone H1 by epifluorescence identifies mitoses from neighboring interphase MDCK cells (bottom). Images are 90 × 90 μm.
Differences in stiffness between mitotic and neighboring interphase MDCK cells in confluency. (Left) 2D quasi topography map reveals the elongated shape of the mitotic cell that protrudes out of the confluent layer. (Right) 2D stiffness map reveals that the mitotic cell is significantly softer than the surrounding interphase cells. (Lower panel) An overlay map of quasitopography and stiffness visualizes the same soft mitotic cell as in (D). Scale bars = 10 μm.
Quantitative AFM analysis of confluent MDCK cells in interphase or in mitosis, in comparison with surrounding cells in interphase that express GFP‐NLP (NLP) or not (WT).
Data information: (A–C, F)
n indicates the number of analyzed cells. Box plots show the mean (square) and median (line); whiskers are s.d., and the box is s.e.m. Statistical significance was tested using a Mann–Whitney test. *
P < 0.05, **
P < 0.01 and ***
P < 0.005, respectively; ns indicates not significant.