-
A, B
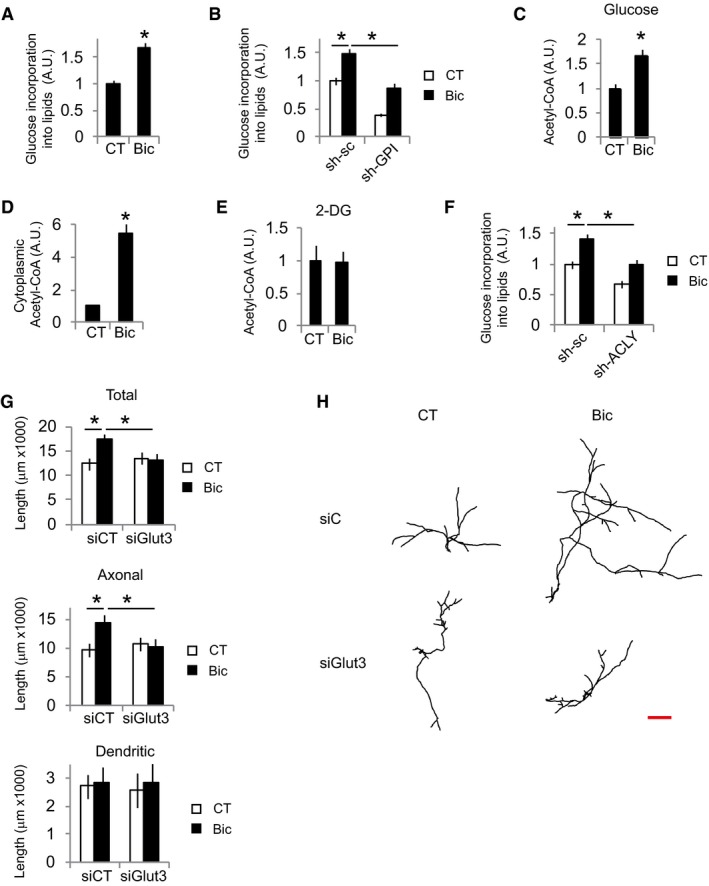
Untransduced (A) or AAV‐shGPI or AAV‐sh‐sc (control) transduced neurons (B) were incubated with 14C‐U‐glucose and were stimulated with bicuculline plus 4‐AP (labeled Bic in this and subsequent figures) for 48 h or left unstimulated (CT). Cellular lipids were extracted and radioactive counts measured (n = 4–7 independent experiments). Values represent mean ± s.e.m. *P < 0.05, two‐tailed Student's t‐test (A) and ANOVA one‐way ANOVA followed by Tukey's post hoc test (B).
-
C
Cortical neurons were stimulated for 24 h with Bic+4‐AP in the presence of glucose (n = 8 independent experiments). After 24 h, total acetyl‐CoA levels were assayed. Values represent mean ± s.e.m. *P < 0.05, two‐tailed Student's t‐test.
-
D
Determination of cytosolic acetyl‐CoA levels after 24 h of Bic+4‐AP stimulation in the presence of glucose (n = 4 independent experiments). Values represent mean ± s.e.m. *P < 0.05, two‐tailed Student's t‐test.
-
E
Acetyl‐CoA levels in cortical neurons stimulated for 24 h with Bic+4‐AP in the presence of 25 mM of the non‐metabolizable glucose analog 2‐DG (n = 4 independent experiments). Values represent mean ± s.e.m.
-
F
14C‐U‐glucose incorporation into lipids in neurons transduced with AAV expressing shRNA‐sc or targeting ACLY (sh‐ACLY) after 48 h stimulation with Bic+4‐AP (n = 7 independent experiments). Values represent mean ± s.e.m. *P < 0.05, one‐way ANOVA followed by Tukey post hoc test.
-
G, H
Neurite length and representative tracings of the neuritic tree of control and Bic+4‐AP‐stimulated neurons (for 48 h) after transfection with non‐targeting (siC) or Glut3‐targeting (siGlut3) siRNAs (n = 45–49 neurons from nine independent experiments). Scale bar, 500 μm. Values represent mean ± s.e.m. *P < 0.05, one‐way ANOVA followed by Tukey's post hoc test.

